My chart this week illustrates how home broadband capabilities have been improving in recent years, although still far short of ambitions to provide ultrafast speeds to most households across the UK.
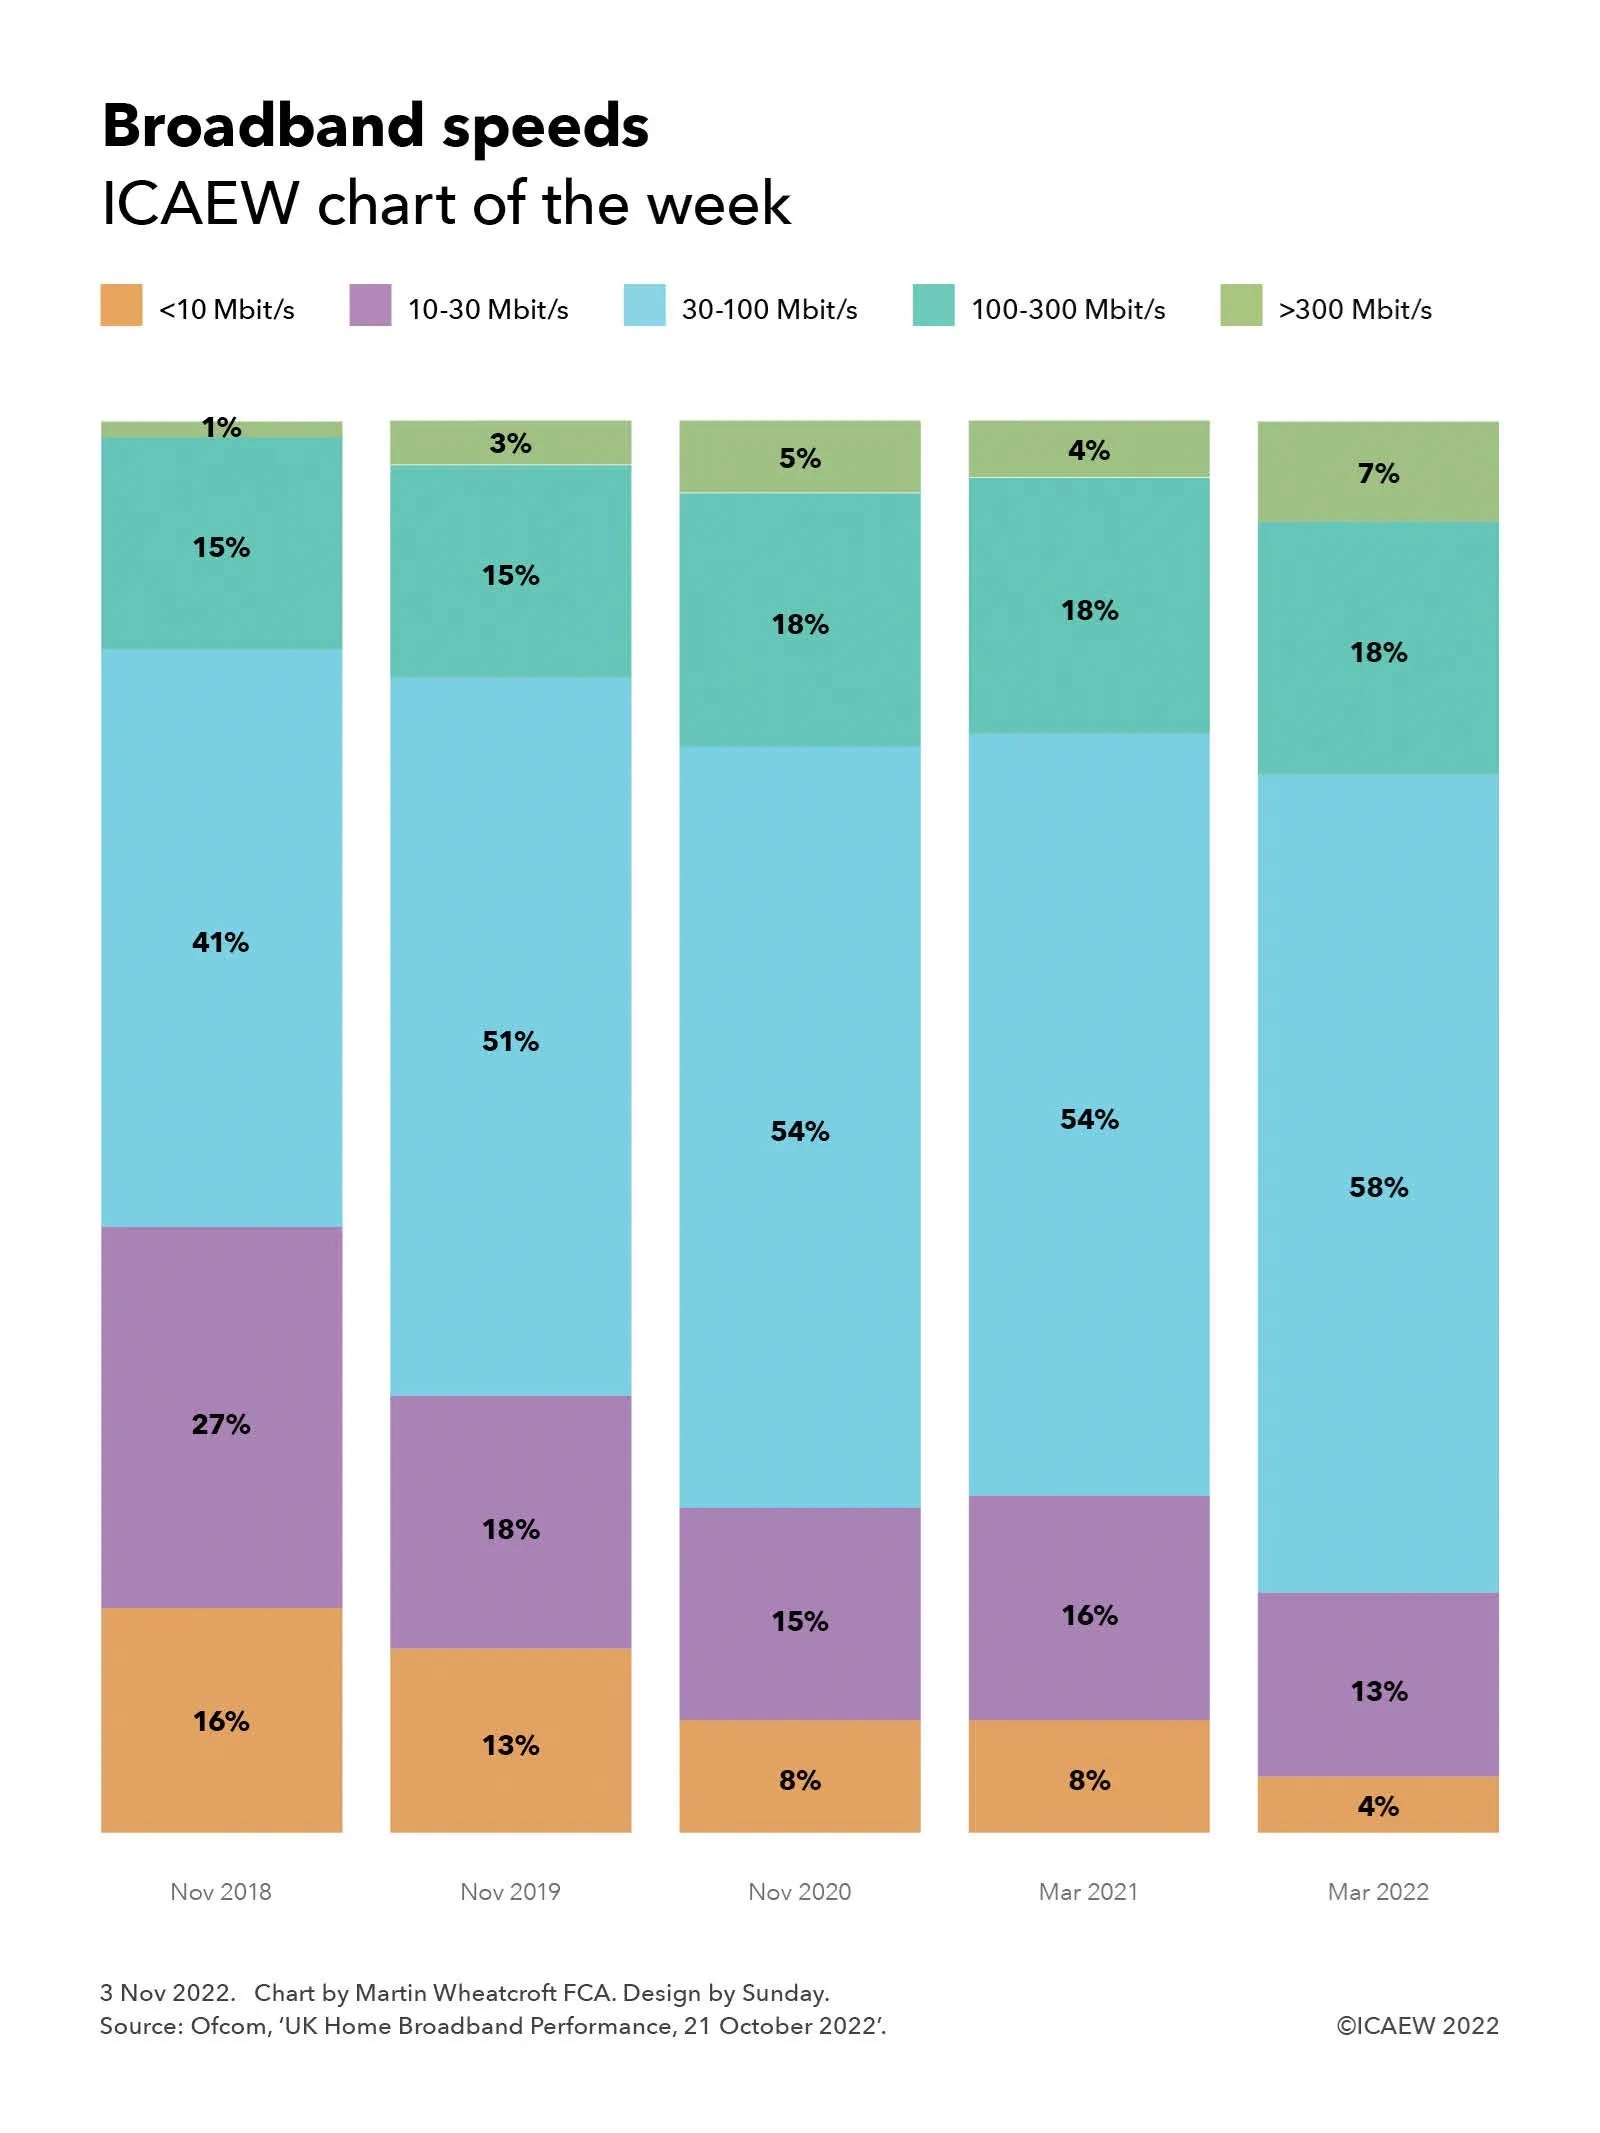
Ofcom recently published its latest data on UK home broadband performance, highlighting how nearly nine in ten (87%) of UK households take a home fixed broadband service.
Based on data as of March 2022, Ofcom reports that connection speeds have continued to improve, with the median average download speed of UK home broadband connections increasing by 18% to 59.4 megabits per second (Mbit/s or Mbps) over the year to March 2022. Over the same period the median average upload speed increased by 9% to 10.7 Mbit/s.
The chart illustrates how speeds have improved since November 2018, when 16% of households had average 24-hour download speeds of 10 Mbit/s or less, 27% had ‘high-speed’ connections (over 10 Mbit/s up to 30 Mbit/s), 41% had superfast broadband (over 30 Mbit/s up to 100 Mbit/s), 15% had extra-superfast broadband (over 100 Mbit/s up to 300 Mbit/s) and just 1% had ultrafast connections over 300 Mbit/s. Overall this meant 43% of households were on what used to be considered high-speed or slower connections and 57% were on superfast or ultrafast connections.
By March 2022, households on slower connections below 10 Mbit/s (mostly legacy ADSL) had fallen to 4% and high-speed connections (10-30 Mbit/s) had fallen to 13%, a drop of 26 percentage points in the proportion of households with high-speed or slower broadband to 17%. The proportion on superfast or higher speeds had increased to 83%, with 58% on superfast (30-100 Mbit/s), 18% on extra-superfast (100-300 Mbit/s) and 7% on ultrafast connections in excess of 300 Mbit/s.
With broadband increasing in popularity, future charts are likely to feature the proportion of gigabit or hyperfast connections of more than 1,000 Mbit/s, while the number of households on less than 30 Mbit/s – now accepted to be too slow for most purposes – should continue to fall as those households upgrade to faster services.
The challenge for Ofcom is in how to improve both rural connectivity and performance, with median average peak-time downloads of 39.4 Mbit/s in rural areas compared with 62.1 Mbit/s in urban areas.
The ‘hyperinflationary’ increase in broadband speeds over recent years suggests that there is a case for redefining the ‘currency’ of broadband speed, given that ‘high-speed’ connections are now commonly accepted to be too slow for practical usage, ‘superfast’ describes a basic level of internet service and ‘ultrafast’ connections are no longer the fastest speeds available.