ICAEW chart of the week: Balance of payments

Our chart this week takes a look at the UK’s balance of payments in the year to 31 March 2025 and wonders what the future has in store.
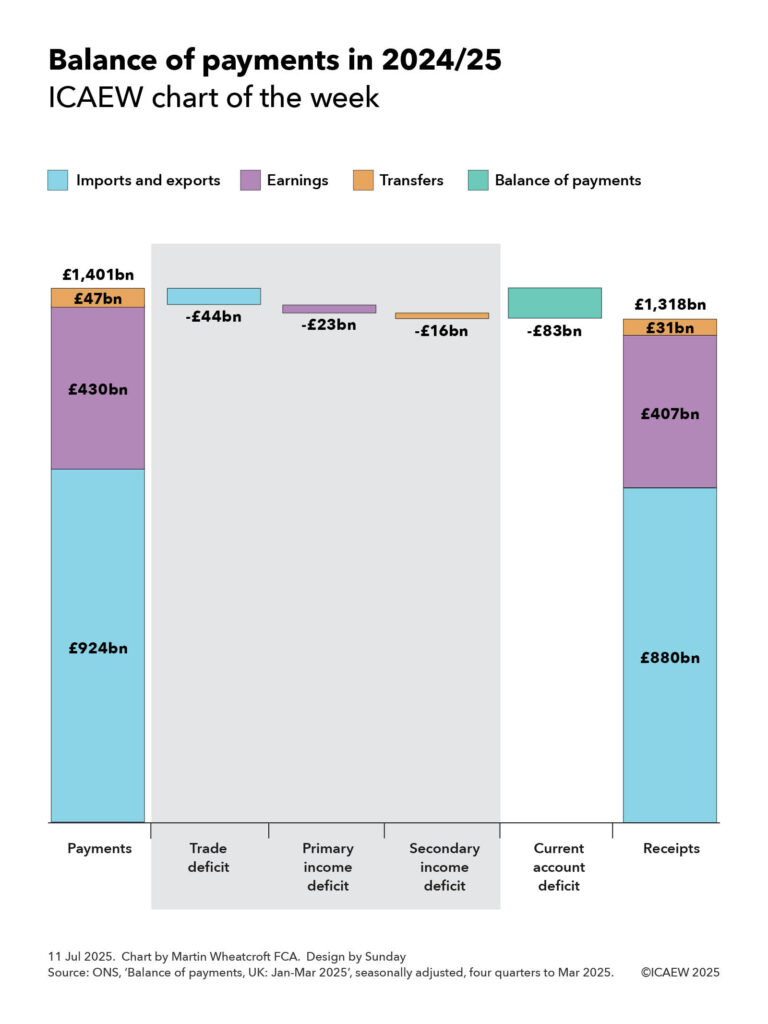
A step chart on the balance of payments in 2024/25 showing payments and receipts on either side, with three shaded sub-steps in-between adding up to the current account deficit, being the difference between total payments and receipts. 

Payments £1,401bn = £924bn for imports + £430bn earnings + £47bn transfers.  

Receipts £1,318bn = £880bn from exports + £407bn earnings + £31bn transfers.  

Step 1: Trade deficit (imports and exports) -£44bn. 
Step 2: Primary income deficit (earnings) -£23bn. 
Step 3: Secondary income deficit (transfers) -£16bn. 

Step 4: Current account deficit (sum of steps 1 to 3) -£83bn.   

11 Jul 2025. Chart by Martin Wheatcroft FCA. Design by Sunday. Source: ONS, 'Balance of payments, UK: Jan-Mar 2025', seasonally adjusted, four quarters to Mar 2025.

The UK is a trading nation as demonstrated by its balance of payments, the topic of our chart this week.

According to the Office for National Statistics (ONS), the UK made external payments of £1,401bn in 2024/25, comprising £924bn in exchange for imported goods and services, £430bn in investment and other earnings paid to foreign investors and workers, and £47bn in remittances, international development aid and other transfers.

On the other side of the ledger, the UK received £1,318bn from external sources in 2024/25 comprising £880bn in exchange for exported goods and services, £407bn from foreign investment and other earnings, and £31bn in remittances and other transfers.

As our chart illustrates, this resulted in a current account deficit of £83bn in 2024/25, comprising a trade deficit of £44bn, a primary income deficit on earnings of £23bn, and a secondary income deficit on transfers of £16bn.

The trade deficit of £44bn can be analysed between a deficit on goods of £239bn (being payments for goods imports of £602bn net of receipts from goods exports of £363bn) and a surplus on services of £195bn (with payments for services imports of £322bn being exceeded by receipts from services exports of £517bn).

The primary income deficit of £23bn principally relates to the £22bn difference between £427bn in investment income and profits generated in the UK paid to foreign owners in 2024/25 and the £407bn received by UK investors from their investments overseas, plus £1bn from the net of £3bn paid in compensation to foreign workers less £2bn earnt by UK workers from foreign sources.

The secondary income deficit of £16bn comprises a net £10bn in government-related transfers, being £11bn in payments made by the UK government (primarily for international development and humanitarian aid) less £1bn received from the EU and others, and a net £6bn from the differences between remittances and other transfers sent abroad of £36bn less remittances and other transfers received into the UK of £30bn.

The chart does not show the other side of the balance of payments, which is a £77bn non-seasonally adjusted surplus on the investment account less a £4bn deficit on the seasonally adjusted capital account, a net cash inflow of approximately £73bn. 

The £77bn surplus on the investment account reflected net investment into the UK of £370bn over the course of the four quarters to March 2025, less £293bn net investment abroad. The £4bn deficit on the capital account primarily relates to international development capital grants, with £1bn from the disposal of non-financial assets to foreign owners offset by £1bn in UK purchases of foreign non-financial assets.

While some of the difference of £10bn between the current account deficit of £83bn and the net surplus on the investment and capital accounts of £73bn is because of timing differences from seasonal adjustments, most of it arises because the ONS is not able to gather data on all international payments and receipts. In theory the balance of payments should balance exactly.

The current account deficit of £83bn in 2024/25 was equivalent to 2.9% of the UK’s GDP of £2,891bn for the same period, being the net of total payments and total receipts of 48.5% and 46.6% of GDP respectively.

Being the difference between two very big numbers, the current account deficit is the net effect of billions of transactions every year as goods and services are bought and sold internationally, earnings are paid and received, and money is transferred at exchange rates that change on a minute-by-minute basis. Despite this the current account deficit in 2024/25 was only 0.1 percentage points higher than the average 2.8% of GDP since 1997, even if it has gone as high as 6.9% in an individual quarter.

While the global trade war was initiated by the US is likely to have a major impact on how money flows around the world, it is much harder to guess how significant that effect will be, either on the overall global economy or on any individual country, in particular the UK. 

Either way, the balance of payments is likely to become a more prominent statistic in the coming months and years. 
This chart was originally published by ICAEW.

ICAEW chart of the week: UK-EU trade in 2024

Our chart this week takes a look at trade between the UK and the EU in the light of the recent trade deal announced by the prime minister and the EU Council and Commission presidents.

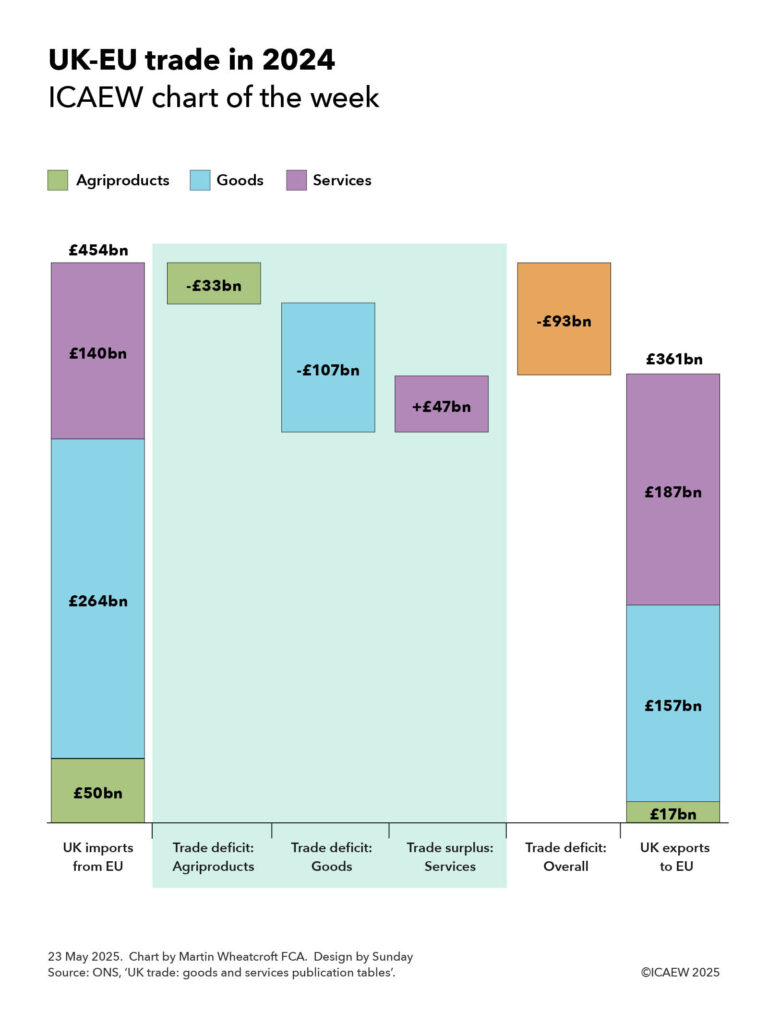
A step chart showing the differences between UK imports from and UK exports to the EU in 2024.    

Left hand column: £50bn imports of  agriproducts + £264bn imports of goods + £140bn imports of services = £454bn total UK imports from EU.    

Steps 1 to 3 in a shaded box, with Step 4 being a subtotal of steps 1 to 3. 

Step 1: -£33bn trade deficit on agriproducts. 

Step 2: -£107bn trade deficit on goods. 

Step 3: +£47bn trade surplus on services.

Step 4: -£93bn overall trade deficit.   

Right hand column: £17bn exports of agriproducts + £157bn exports of goods + £187bn exports of services = £361bn total UK exports to EU.   

23 May 2025. Chart by Martin Wheatcroft. Design by Sunday. Source: ONS, 'UK trade: goods and services publication tables'.

The European Union is the UK’s largest trading partner, with the UK importing goods and services from its 27 member countries worth £454bn at current market prices in 2024, and the UK exporting goods and services to EU countries worth £361bn.

UK imports from and exports to the EU represent 50% and 41% respectively of the UK’s total imports and exports of £906bn and £873bn in 2024. This is equivalent to 16% and 13% of estimated GDP in 2024 of £2,851bn, out of total imports and exports of 32% and 31% of GDP respectively.

Our chart this week analyses trade with the EU between £50bn, £264bn and £140bn in imports of agriproducts, other goods, and services, and £17bn, £157bn and £187 in exports of agriproducts, goods, and services. As the chart illustrates, the trade deficits on agriproducts and goods are £33bn and £107bn respectively, while there is a trade surplus on services of £47bn. Overall the UK imports £93bn more from the EU than it exports to the EU.

Agriproduct imports and exports of £50bn and £17bn (1.8% and 0.6% of GDP) consist of purchases and sales of food and live animals (£39bn and £11bn), beverages and tobacco (£9bn and £5bn), and animal and vegetable oils and fats (£2bn and £1bn). 

Goods imports and exports of £264bn and £157bn (9.3% and 5.5% of GDP) respectively comprise machinery and equipment (£127bn and £65bn), material manufactures and other manufactured goods (£67bn and £36bn), chemicals (£46bn and £28bn), energy (£15bn and £24bn), raw materials (£6bn and £3bn), and unspecified goods (£3bn and £1bn). With the exception of energy, we buy more goods from the EU than we sell them.

Services imports and exports of £140bn and £187bn (4.9% and 6.6% of GDP) during 2024 include business and professional services (£42bn and £67bn), travel and tourism (£53bn and £18bn), financial services (£11bn and £40bn), transport (£17bn and £16bn), IT services (£7bn and £21bn), intellectual property (£5bn and £16bn), and other services (£5bn and £9bn). We sell more to the EU than we purchase in services, with the main exception being travel and tourism, where holidays in Europe are a big factor.

The trade deal between the UK and the EU announced on 19 May 2025 primarily focuses on food and other agriproducts, a relatively small proportion of total trade between the UK and the EU. This perhaps explains why the anticipated benefits to the UK economy of the new trade deal are also relatively small at £9bn a year by 2040, just 0.3% of GDP. 

Most of our trade with the EU is in goods and services that, apart from energy, are not directly impacted by this deal. Despite that, the deal is expected to be positive for the farming and fishing communities that will be hoping to reverse a 19% drop in food exports since 2019. EU producers will also be hoping to reverse the 5% fall in their food exports to the UK over the same period. 

Taxpayers will also benefit from being able to avoid the cost of imposing restrictions on food and agricultural imports that were never fully implemented and will now no longer be needed.

While the economic benefits of the deal may be fairly small, as the saying goes: “Every little helps.”