This article features in the May 2021 edition of TAXline, ICAEW Tax Faculty’s monthly magazine. One article is freely available each month.
With the pandemic increasing pressure on public finances, could this prompt overdue discussions on tax reform? ICAEW’s Head of Tax Frank Haskew and independent adviser Martin Wheatcroft reflect on recent announcements and challenges facing the Chancellor.
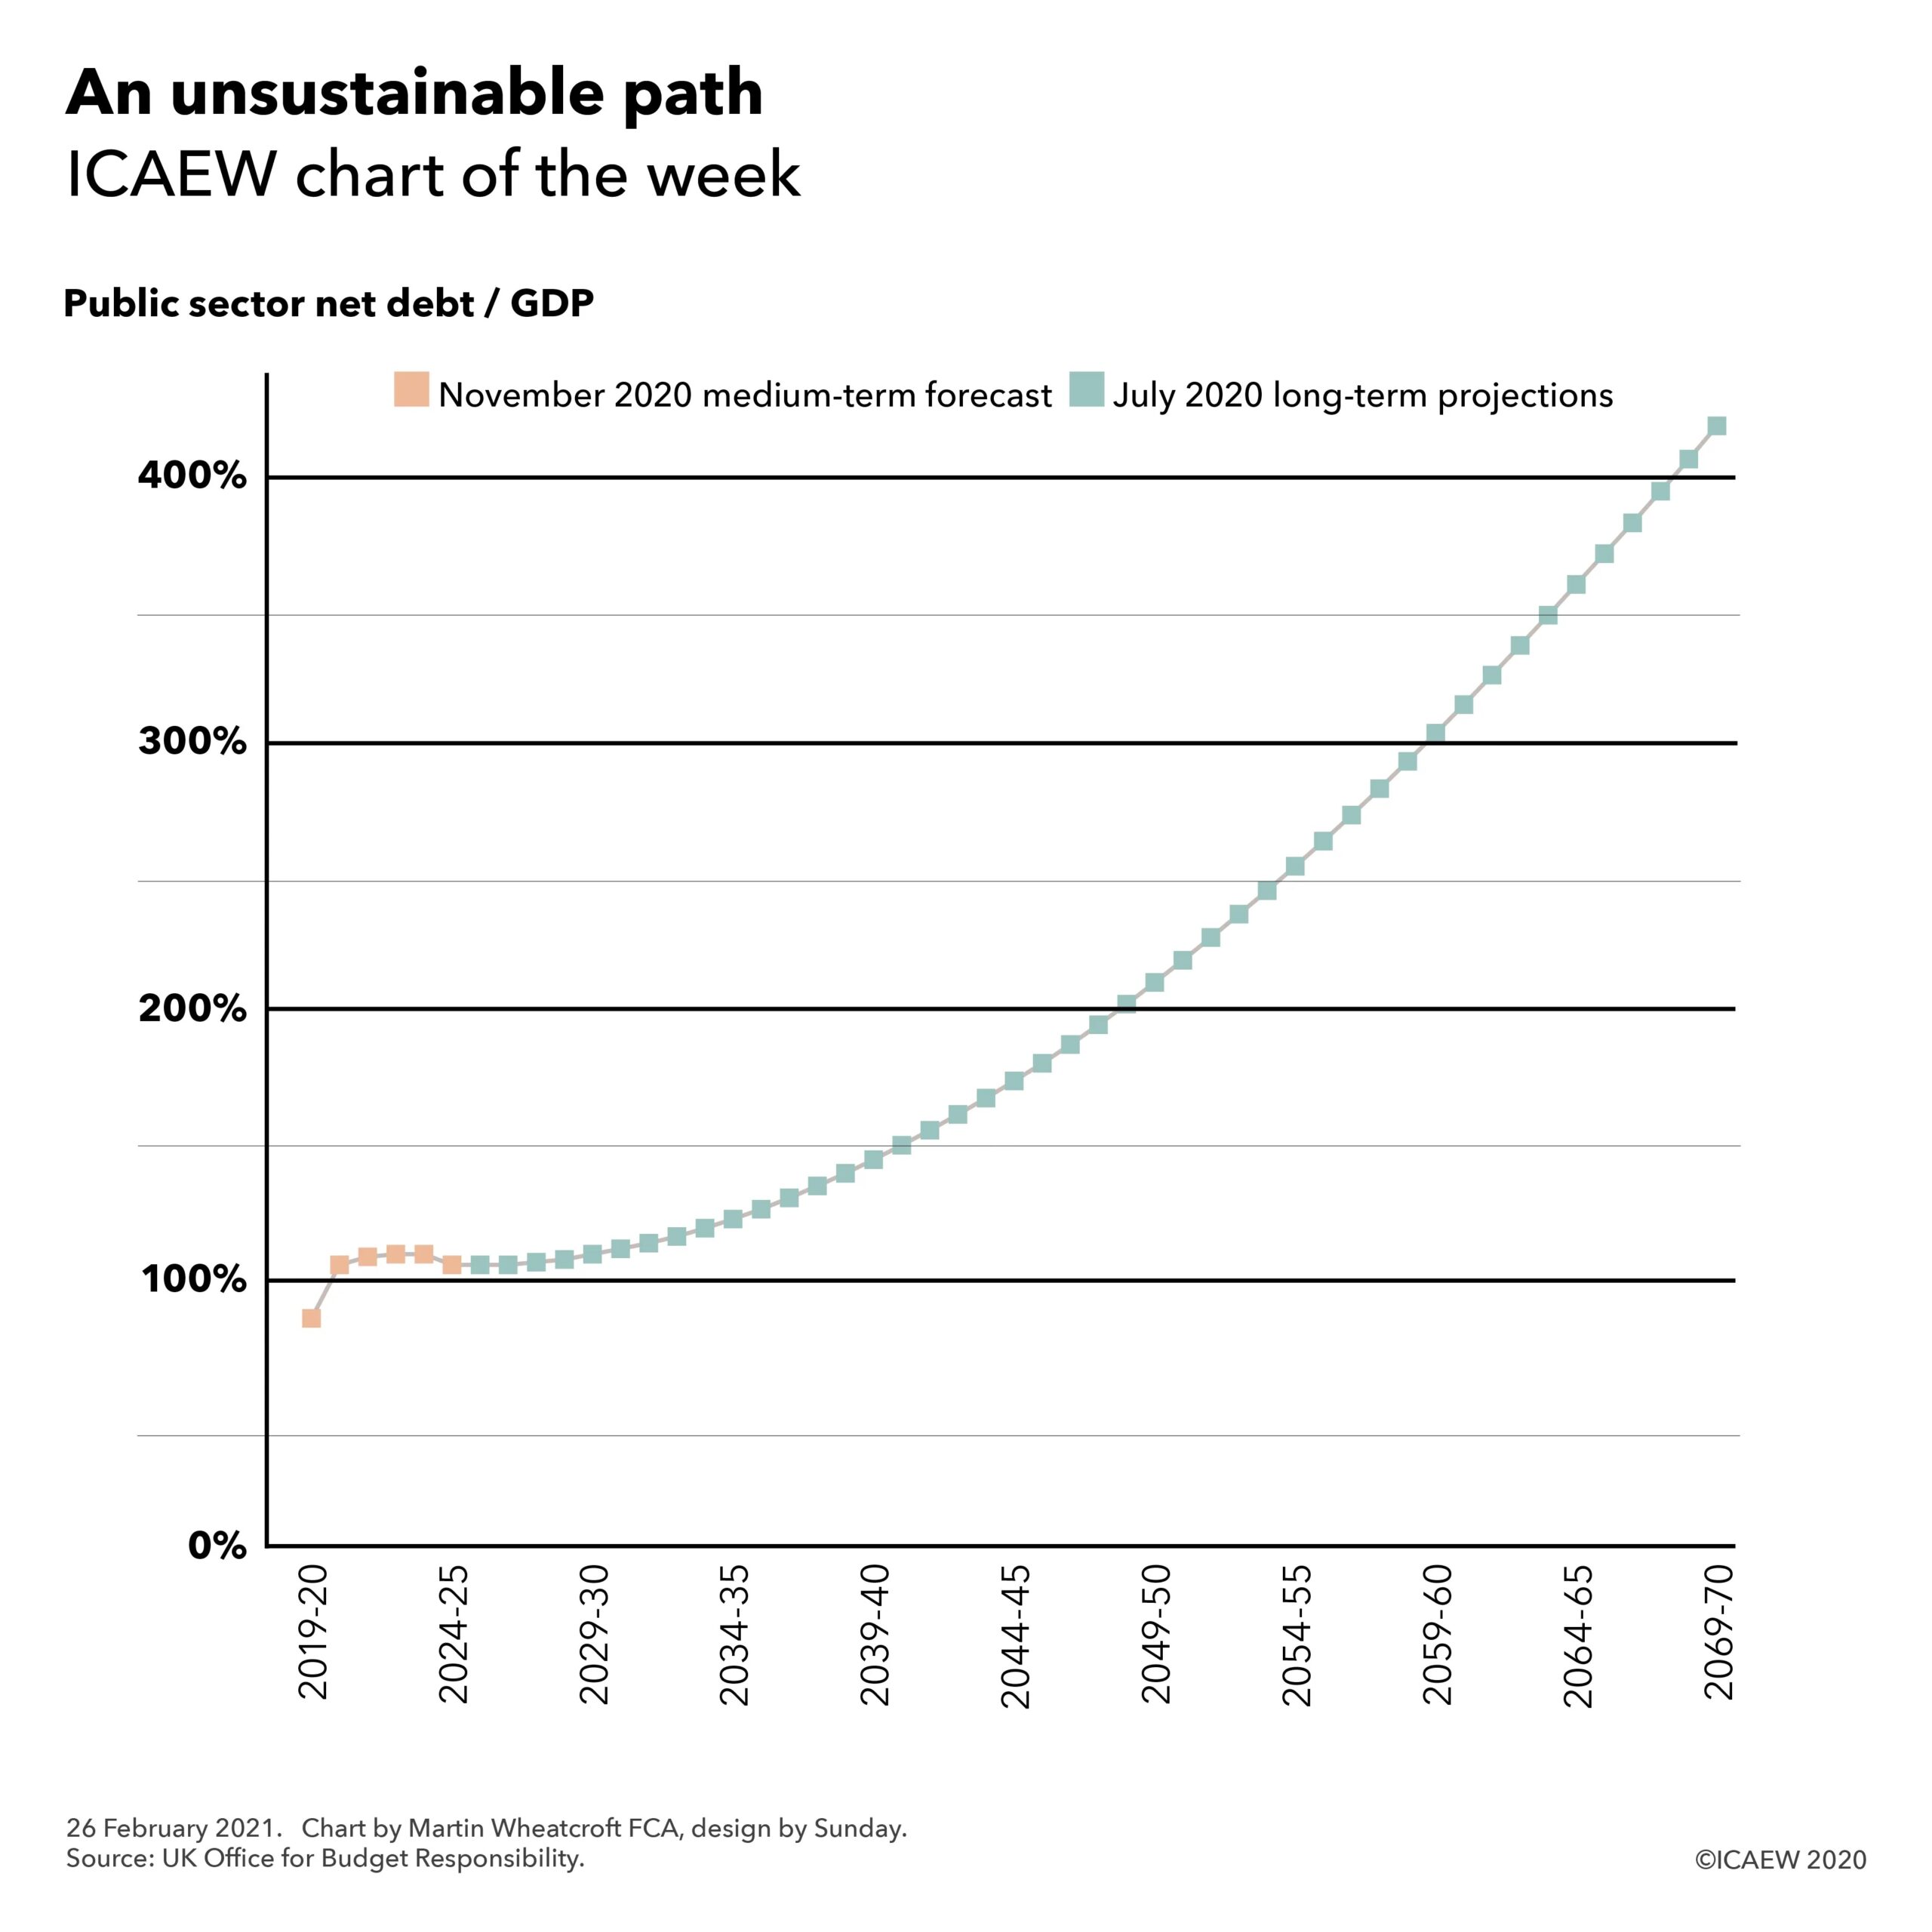
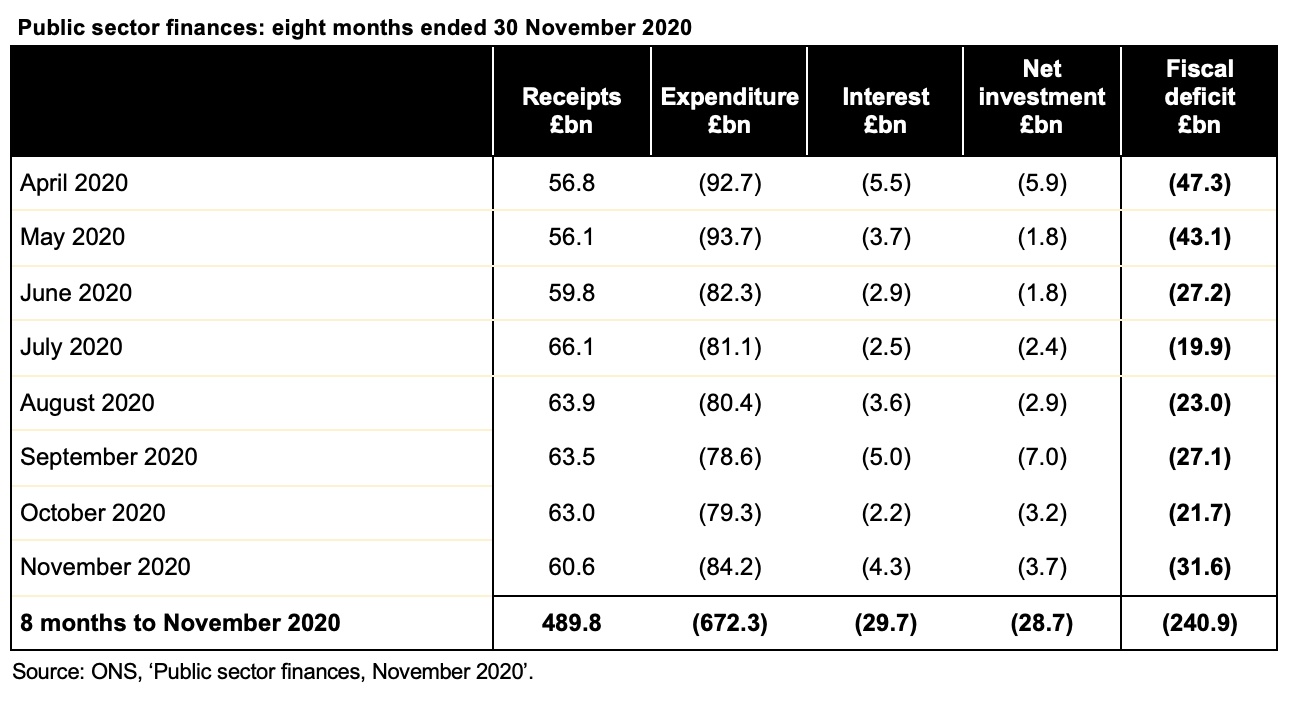
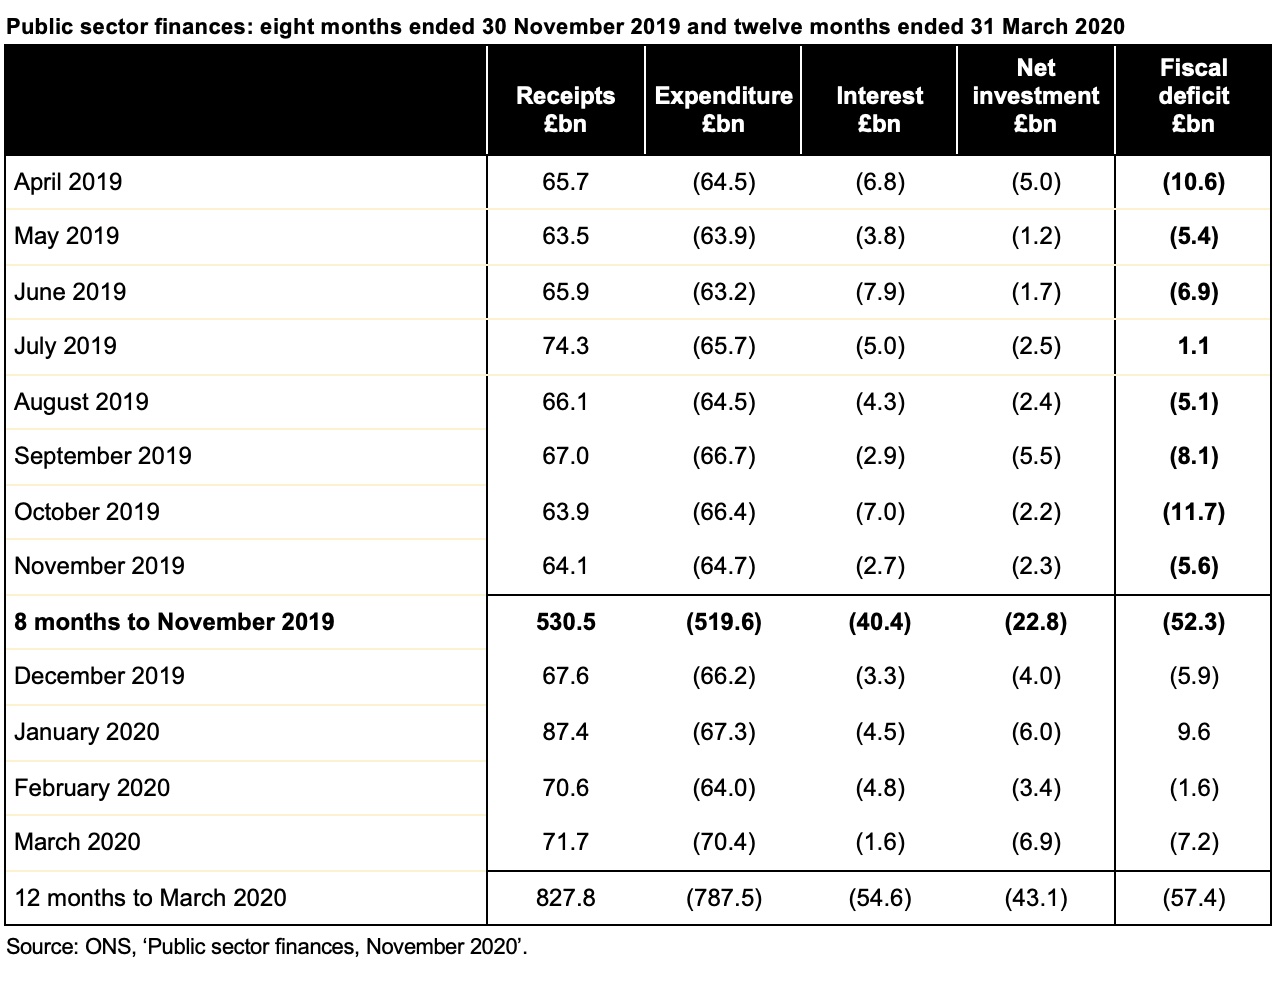
With the UK’s deficit set to increase to £2.5tn by 2023, the fact that tax revenues do not cover public spending is starker than ever. However, the problem of balancing the books far predates COVID-19.
An aging population coupled with funding and tax administrative decisions made many decades ago have meant that the gap has been slowly but inexorably widening. Frank Haskew, Head of Tax at ICAEW, says: “Since the turn of the century, we have been running deficits almost every year. The fact is that we’re not raising enough tax meet to our day-to-day spending commitments.”
Martin Wheatcroft, an independent adviser and author on public finances who works closely with ICAEW, explains: “People are living longer which is a good thing, but it has a financial impact. For example, the NHS spends an average of £80 a month on 18-year-olds, while for 80-year-olds that cost is more than £500. The perennial issue is that we don’t have a clear long-term strategy for how the government, or any government, plans to deal with that.”
To balance the books, the primary strategy of governments has been to grow the economy and have a moderate level of inflation to inflate away debt. However, financial crises and recessions have meant that in the past decade growth has been a lot weaker than expected. George Osborne, for example, was forced to leave the Exchequer without fulfilling his pledge of eliminating the deficit due to the underperformance of the economy. “When you combine the demographic pressures with slower economic growth then it’s a difficult situation,” says Wheatcroft.
Paying for coronavirus
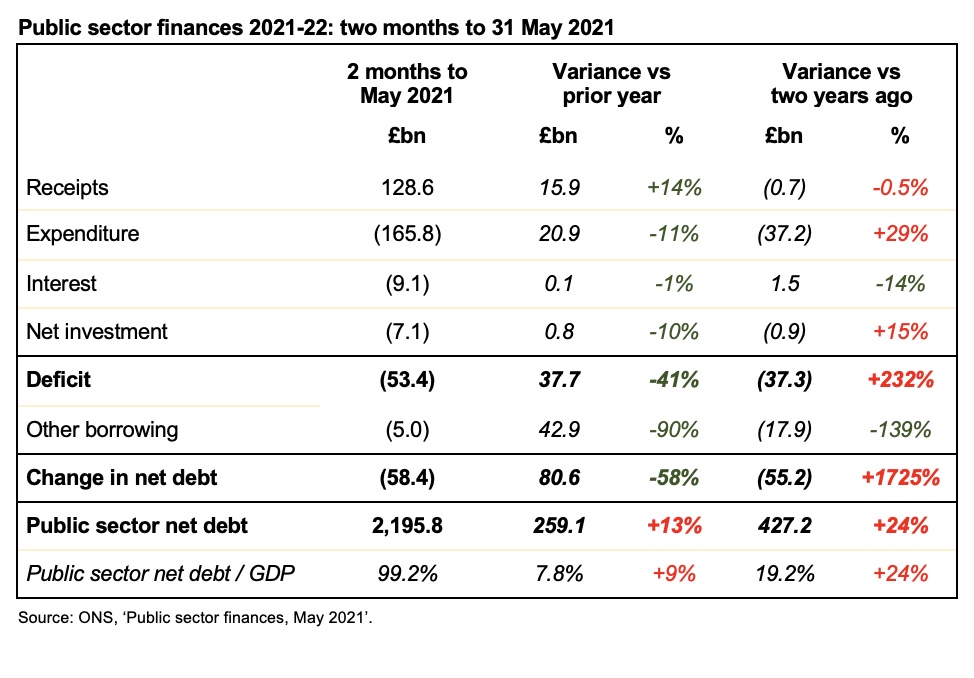
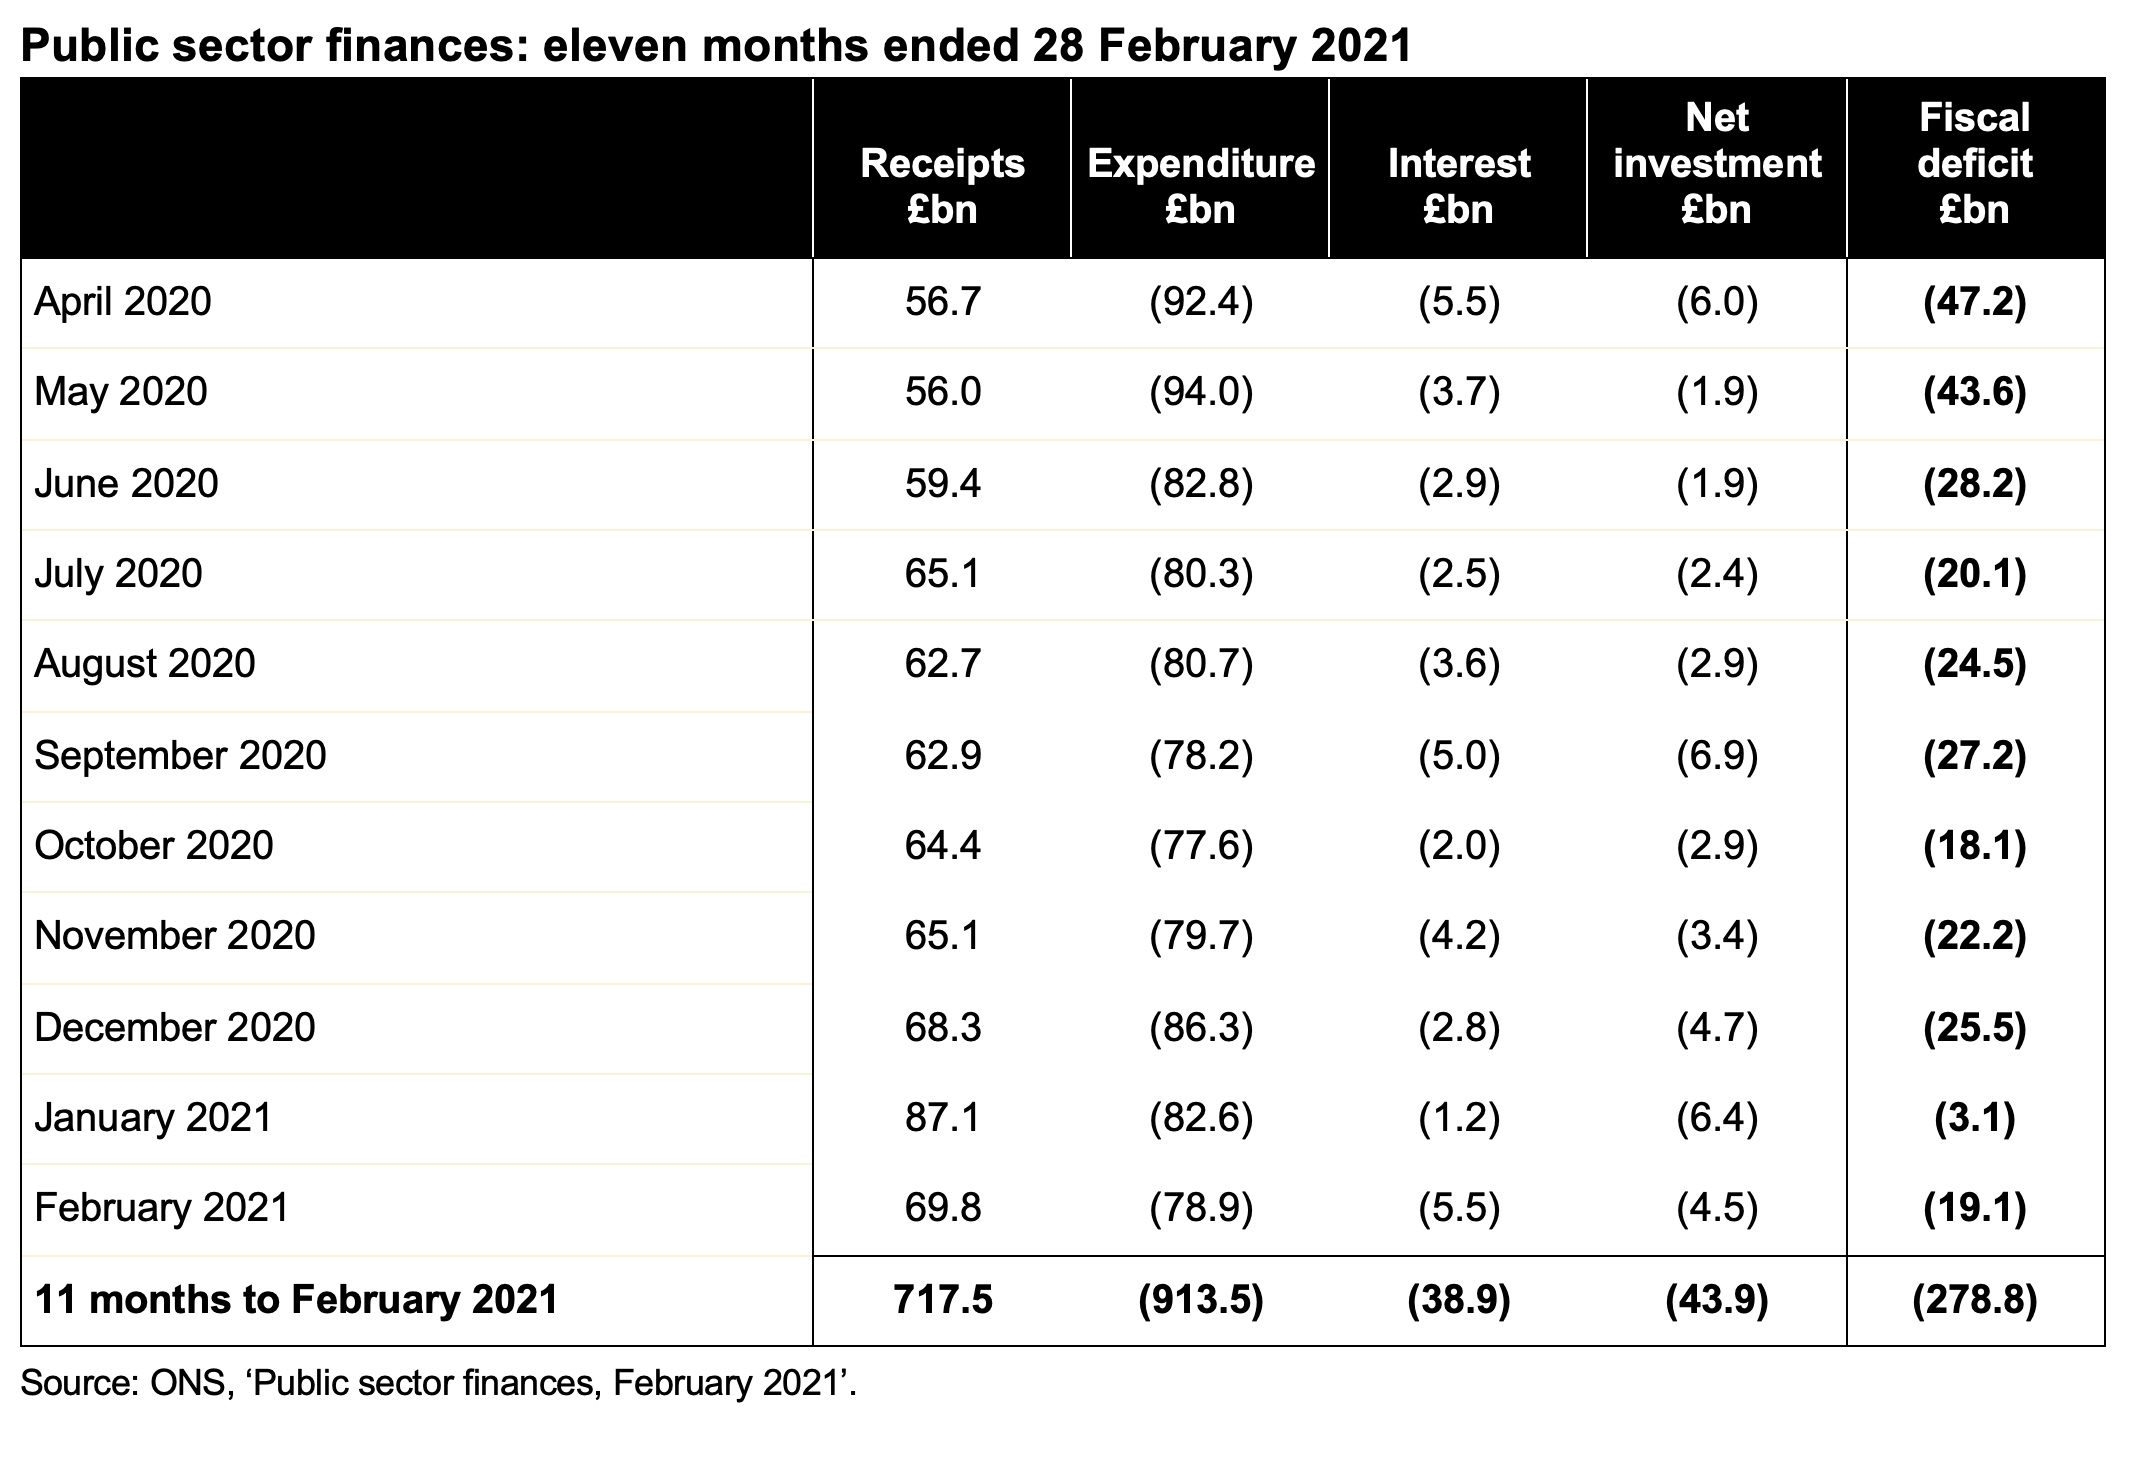
Into this strained situation enters a global pandemic and its huge financial repercussions. Alongside the severe and prolonged impact on economic activity, stimulus and support packages are expected to add between £0.5tn–£1tn onto UK debt in the next few years.
Ahead of the Budget in March, the expectation was that the Chancellor would be looking for ways to raise revenues to help cover the costs of COVID. However, the measures announced will not do so – in the short term at least.
“It’s fair to say that there was no serious attempt to tackle a growing fiscal deficit in the Red Book,” says Haskew. “The 2019 manifesto pledge that there would be no rise in VAT, income tax or national insurance means that the Chancellor is prevented from the most obvious, and quick, ways in which to raise revenues.”
The flagship measure for revenue raising in the Budget was the increase to corporation tax rates. However, as the change will not come into effect until 2023, this will not provide a quick cash injection. Haskew also argues that the fiscal impact may not be significant. “The potential corporation tax revenues over the forecast period are pretty much balanced by the cost of the super deduction. In overall terms any difference is probably loose change,” he says.
Wheatcroft believes the measure gives an indication of the government’s medium-term plans. “One of the more positive things you can do in the medium term to get your public finances under control is encourage stronger economic growth. By taking action on corporation tax the government wants to try and at least stabilise the situation.”
Reallocating spending
Evidence for where the Chancellor is securing finance in the short term can be seen in the integrated defence review published on 16 March, which confirmed that the size of the army would be further reduced by 2025. “Since the 1950s the UK has cut defence spend from 10% of GDP down to 2%. Reallocating that finance to healthcare that has helped successive governments avoid increasing taxes,” explains Wheatcroft. “However, with defence spend now just above the NATO minimum, there’s no further capacity and taxes are going to have to go up at some point.”
Haskew agrees: “The measures announced so far are just nibbling at the edges of the problem. The UK has a strategic question as to whether it tackles the deficit and if so how. Since the start of the pandemic there’s been suggestions from some commentators that capital gains tax and inheritance tax might rise, and other have proposed wealth taxes, but we saw none of those suggestions in the Budget. It shows just how hard it is to raise taxes.”
The need for change
There are a number of areas of the UK tax system that have been ripe for reform for many years, including the differences between the taxation of the employed and self-employed. “We’ve had a position of significant difference between these two types of taxpayer for 20 years and more. Successive governments, of every political hue, have identified it as a concern but never successfully addressed it,” says Haskew.
He cites Philip Hammond’s attempt to make relatively modest changes to national insurance contributions for the self-employed in 2017, which were reversed within a week.
Wheatcroft, meanwhile, points to the perennial thorny issue of business rates and the interim review published as part of HM Treasury’s Tax Day announcements on 23 March. “Everybody was in total agreement that it’s a bad tax and needs reform, but they were also very unhappy about the main alternative option,” he says. “There’s definitely an inertia bias when it comes to changing taxes because it is so difficult. It’s much easier to stay with the current ones, simply because they already exist and they are collecting revenue, however imperfectly.”
Haskew agrees: “These cases highlight that a lot of the structural problems in the tax system have become so ingrained that trying to change them is almost impossible.”
Catalyst for reform
Decisions on how to balance the books have been getting increasingly difficult year on year, but could the dramatic impact of the pandemic provide the impetus for the government to set out a long-term vision of how to tackle the deficit and for Rishi Sunak to make some brave choices?
“From a public support point of view, this past Budget was politically the best possible time to raise taxes, with everyone understanding the financial impact of the interventions that the government has had to take,” says Wheatcroft. “However, from an economic perspective it would be the worst time. At the moment the government wants to do everything possible to encourage a strong economic recovery. This is probably why the government took the opportunity to pre-announce raising corporation tax rates now, rather in three years’ time immediately prior to a general election.”
Wheatcroft suggests that the Chancellor has potentially another 12 months of political goodwill in which to implement changes and suggests that Tax Day is a good indication of travel. “The very fact of having a Tax Day announcing the consultations and setting out a 10-year strategy, which it did last year, is a positive sign of longer-term thinking,” he says.
Haskew believes that now is the time to start having a national conversation about the future of tax and cites a Treasury Committee report, Tax after coronavirus, published on 1 March as a step in the right direction. “It’s a really interesting report because there was a consensus among the cross-party members about proposals to try and address some of these issues,” he says.
“The deficit and tax reform are more than political issue, so reaching a consensus was really encouraging,” he says. “We have this growing problem as a nation, so what are we going to do about it? These things need to be debated, to see whether we can reach some consensus about the best way of raising tax without harming productivity.”
This article was originally published by ICAEW.