ICAEW chart of the week: Employment costs

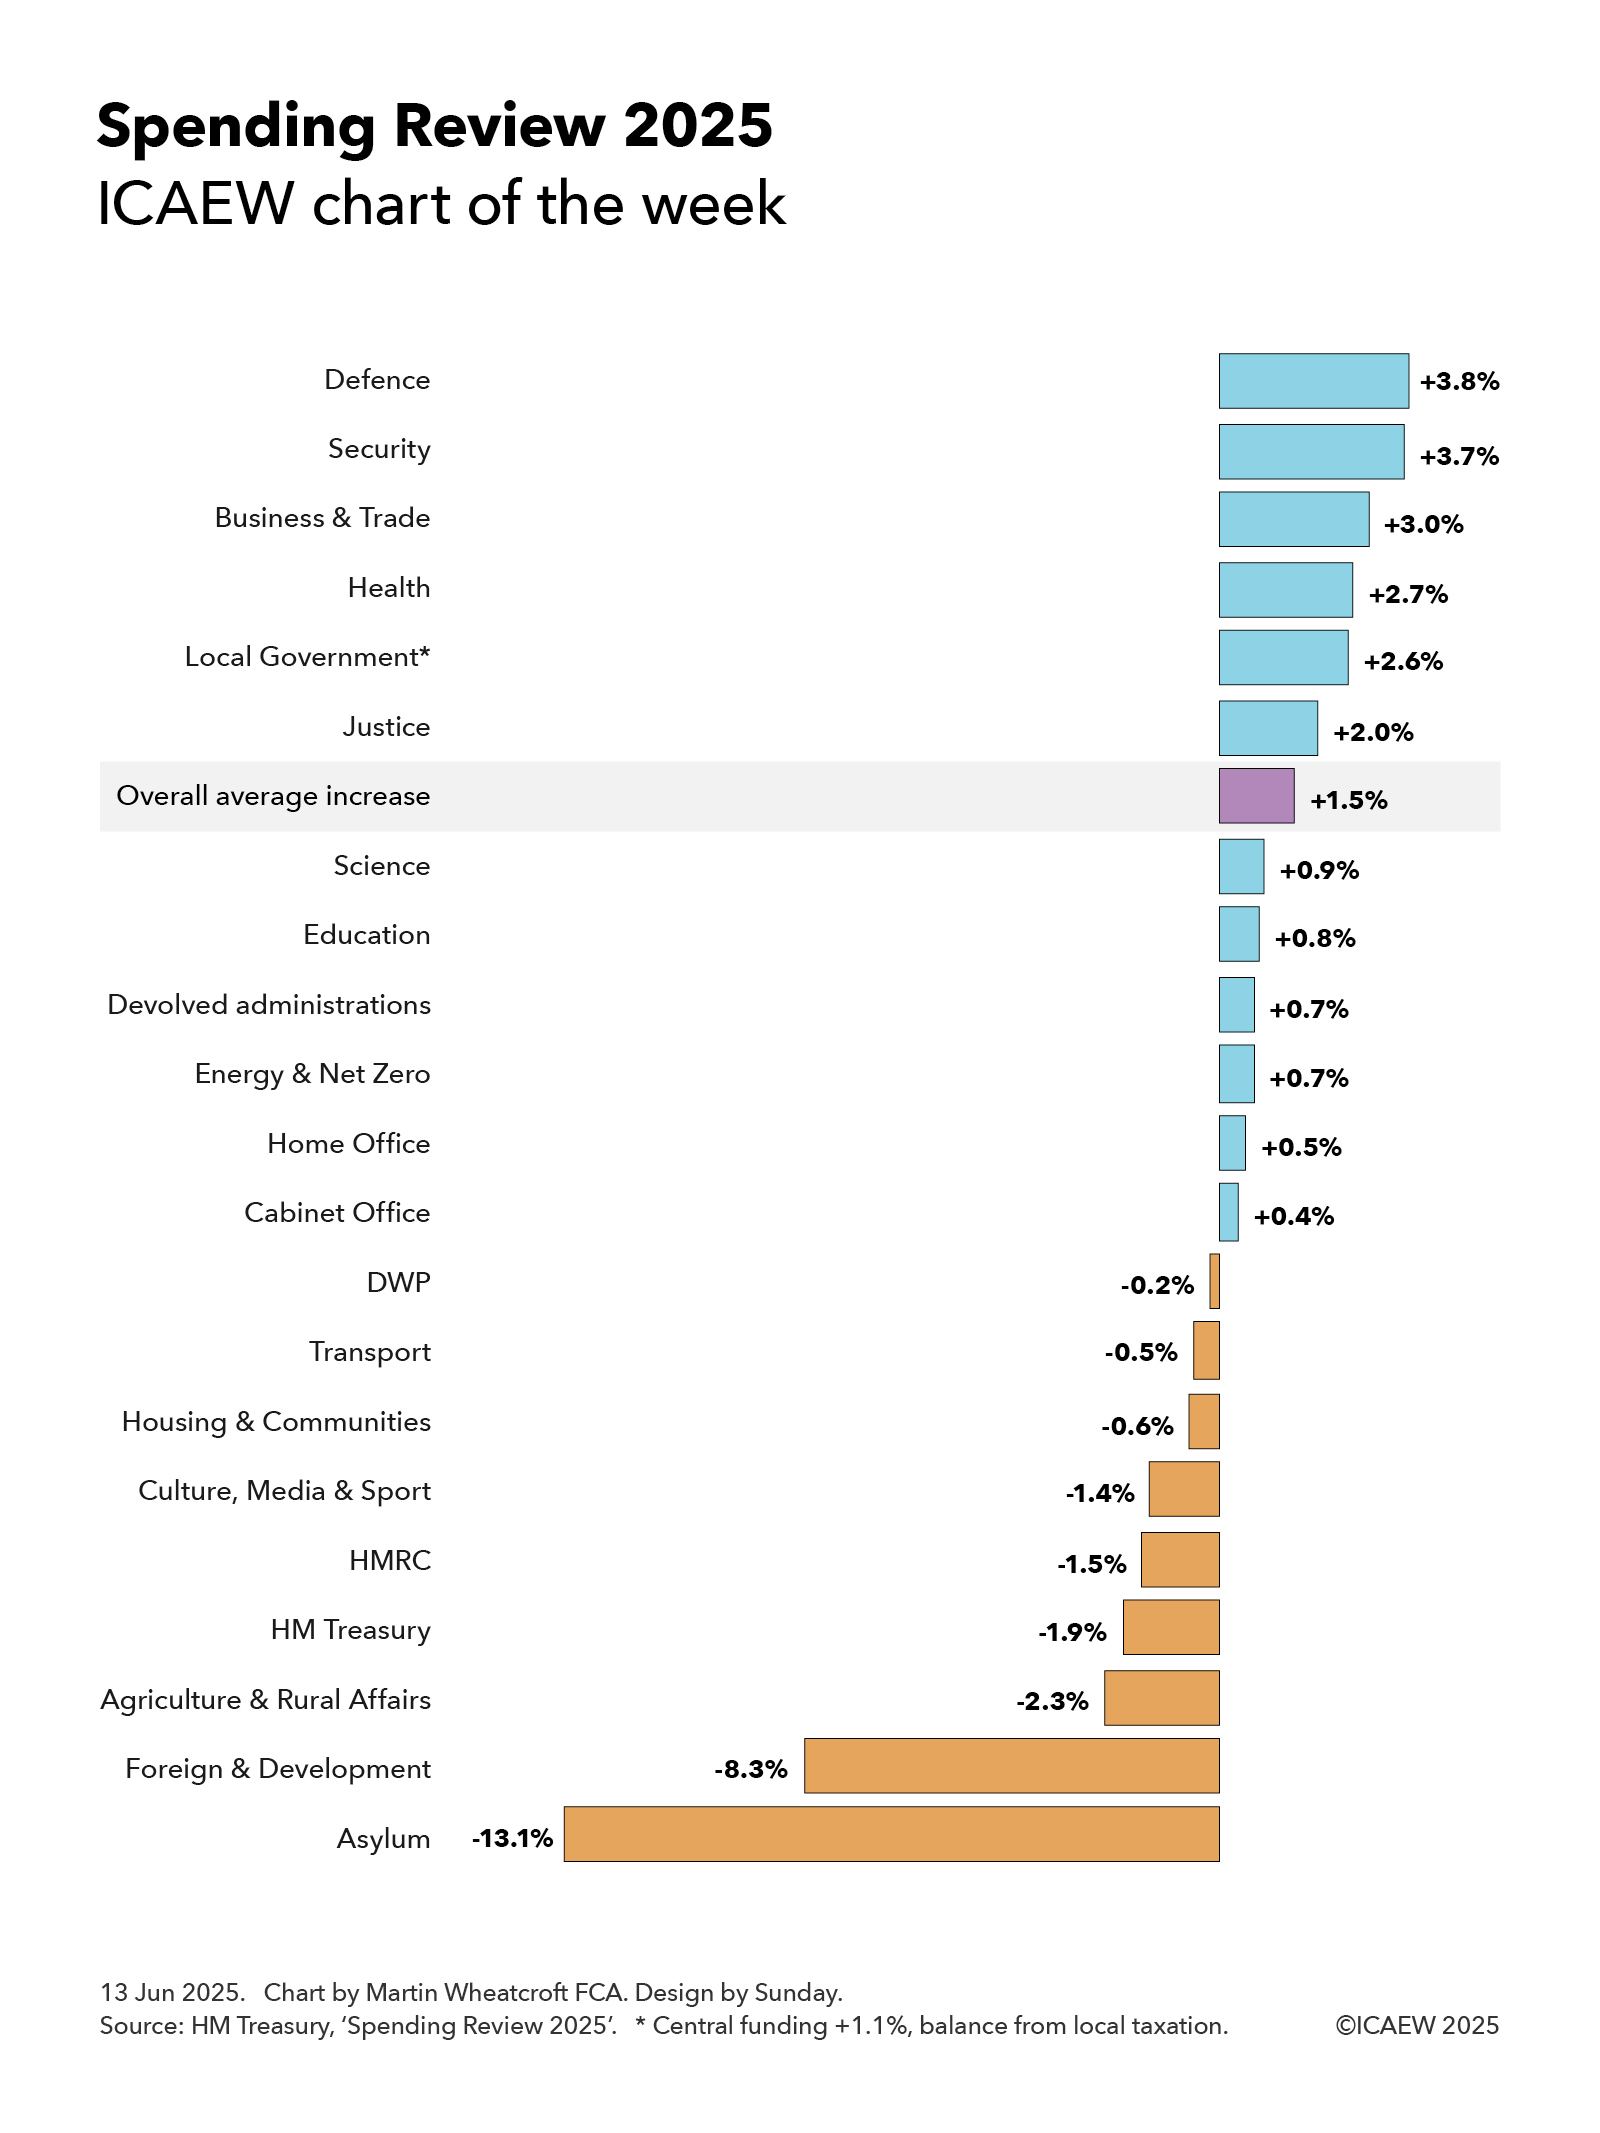
My chart for ICAEW this week looks at how employment costs in June 2025 have risen by 4.8% compared with the same month last year, adding to the expense of doing business in the UK.

ICAEW chart of the week on employment costs. 

A step chart showing the changes between the UK monthly payroll in June 2024 and June 2025.

June 2024: £96,975m UK total gross salaries + £8,848m UK total employer national insurance.

Step 1: -£520m from 0.5% fewer employees. 
Step 2: +£3,985m from 3.6% increase in salaries. 
Step 3: +£1,666m from 17.9% higher employer national insurance. 

Net change: +£5,131m. 

June 2025: £100,000m UK total gross salaries + £10,954m UK total employer national insurance. 

12 Sep 2025. Chart by Martin Wheatcroft FCA. Sources: ONS, 'PAYE real time information, non-seasonally adjusted'; HMRC, 'Monthly tax receipts'.

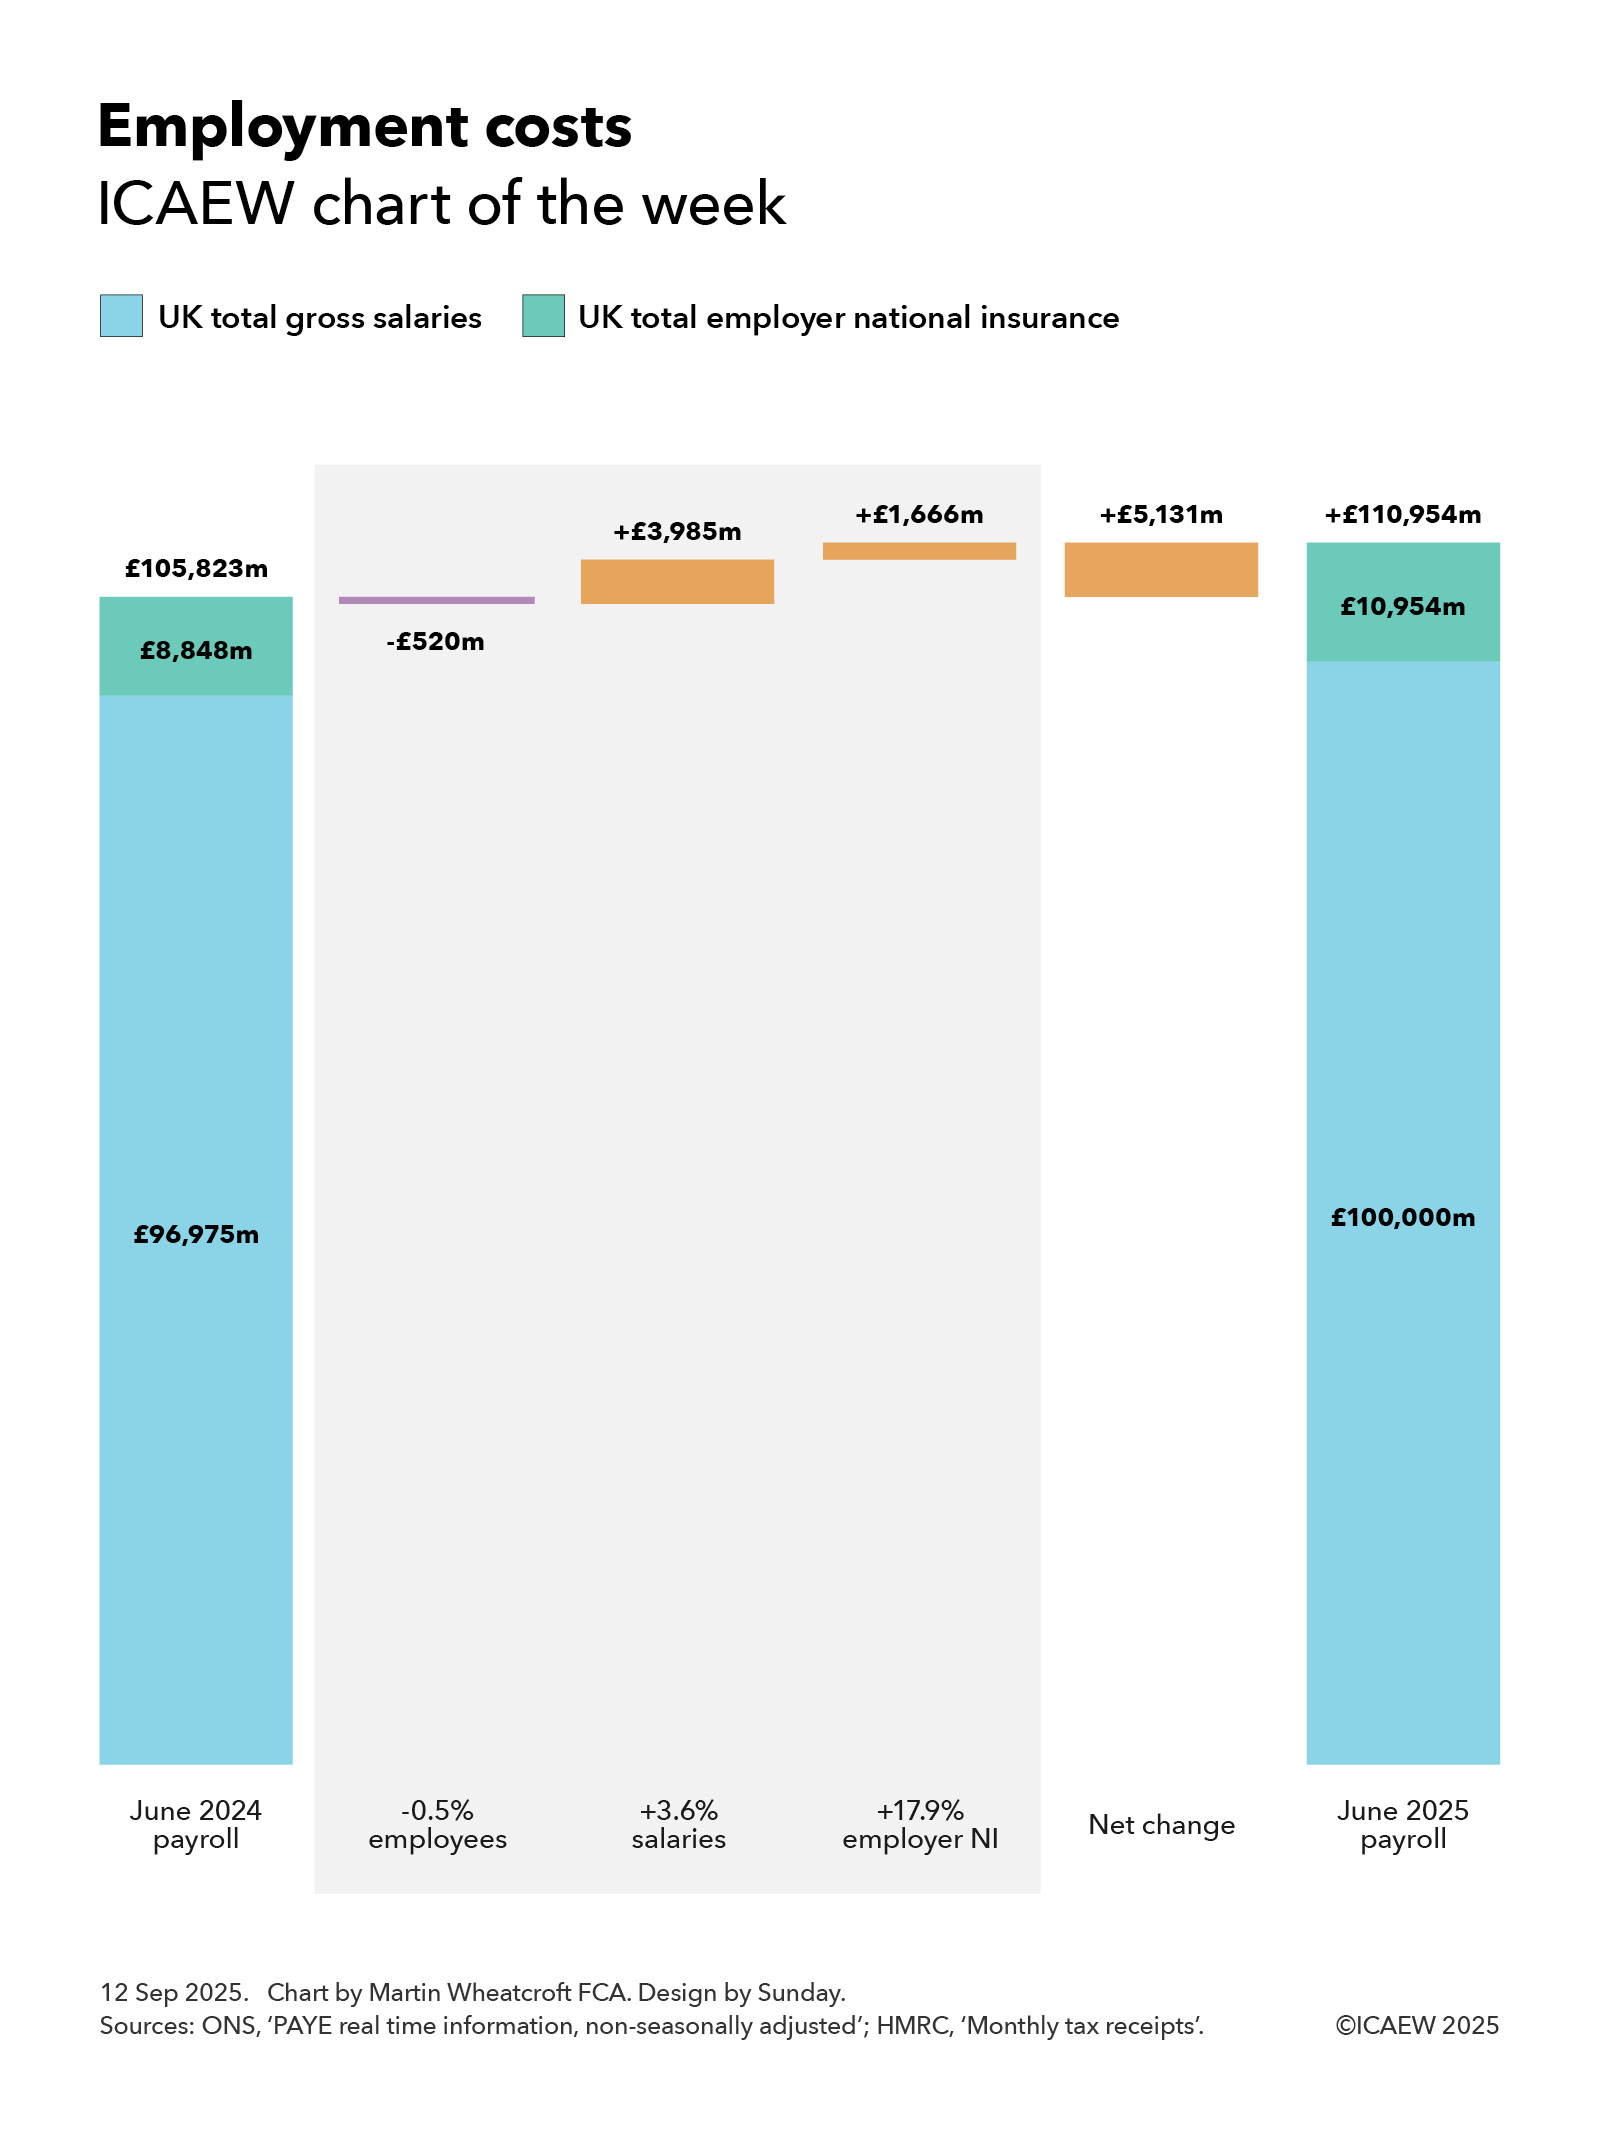
According to the Office for National Statistics (ONS) and His Majesty’s Revenue and Customs (HMRC), UK employers paid a total of £111bn in gross salaries and employer national insurance in June 2025, an increase of £5.1bn or 4.8% over the same month a year ago.

My chart this week starts with the payroll in June 2024 of £105,823, comprising gross salaries paid by employers of £96,975m and employer national insurance of £8,848m, although it excludes employer pension contributions.

This monthly cost was reduced by £520m from a reduction in the national workforce, which saw the number of payrolled employees drop by 149,937 or 0.5% from 30,532,600 in June 2024 to 30,382,663 in June 2025. This arose from 7,296,859 leavers exceeding 7,146,922 joiners, most of which are people moving jobs. The reduction in the number of payrolled employees at a time of still-rising overall population numbers highlights the difficult economic situation currently facing the UK. The reduction comprised £476m in less pay and £44m in less employer national insurance (calculated at last year’s rates)

Salary increases since last year of approximately 3.6% added £3,985m or 3.8% to the cost of employment, with mean salaries increasing from £3,176 in the month of June 2024 to £3,291 in the month of June 2025. This comprised an increase of £3,501m or 3.6% in gross salaries and an estimated increase in employer national insurance of £484m or 5.5% (based on last year’s rates).

The median monthly salary increased from £2,389 in June 2024 to £2,530 in June 2025, which is a 5.9% increase compared with a year previously. This was less than monthly pay at the 25th percentile, which increased by 7.8% from £1,408 to £1,518, which was partly driven by a 6.7% increase in the minimum wage implemented in April 2025 (16.3% for those aged 18 to 20 and 18% for those aged under 18) that help lift the salaries of lower paid workers.

Pay at the 75th percentile increased by 4.7% (from £3,632 to £3,803) compared with a year previously, while pay at the 95th and 99th percentiles increased by 3.1% (from £7,461 to £7,692) and 2.6% (from £15,181 to £15,583) respectively. These lower rates of increase for higher paid workers primarily relate to base pay and so do not tell the full story as bonuses and other variable compensation for 2025 will in most cases not show up in pay packets until early next year.

A further £1,666m or 1.5% was added to the total cost of employment as a consequence of changes in employer national insurance effective from April 2025. These took the rate payable by employers from 13.8% of salaries over £792 a month to 15.0% of salaries above £417 per month, adding an extra 17.9% to the amount paid in employer national insurance after taking account of changes in the number of payrolled employees and salary increases since last year. Just under half of the increase (£808m) resulted from the change in the main rate of employer national insurance going up from 13.8% to 15.0% on salaries above £792 a month, with the balance (£858m) coming from lowering the threshold at which the 15.0% applies to £417 per month.

The overall effect was a net increase of £5,131m or 4.8% in total pay and employer national insurance to £110,954m in June 2025, comprising a net increase of £3,025m or 3.1% in total gross salaries to £100,000m and a net increase of £2,106m or 23.8% in employer national insurance to £10,954m.

The chart does not reflect the full cost of employment as it does not include employer pension contributions, non-payrolled benefits, and employment-related costs such as facilities, equipment, training and travel amongst others. However, it still gives a useful illustration of how payroll costs have changed significantly over the course of one year.

ICAEW’s growth campaign identifies how it is too difficult, expensive and uncertain to do business in the UK and calls for the government to do what it can to streamline regulations, reduce unnecessary costs, and provide businesses with the confidence they need to invest.

This chart was originally published by ICAEW.

ICAEW chart of the week: Spending Review 2025

My chart for ICAEW this week looks at the government’s priorities as expressed through departmental budgetary allocations over the next three years.

A bar chart showing the average annual real-term percentage increase in departmental spending over the three years to 2028/29.

Defence +3.8%. 
Security +3.7%. 
Business & Trade +3.0%. 
Health +2.7%. 
Local Government. +2.6% (central funding +1.1%, balance from local taxation). 
Justice +2.0%. 
Overall average increase +1.5%. 
Science +0.9%. 
Education +0.8%. 
Devolved administrations +0.7%. 
Energy & New Zero +0.7%. 
Home Office +0.5%. 
Cabinet Office +0.4%. 
DWP -0.2%. 
Transport -0.5%. 
Culture, Media & Sport -1.4%. 
HMRC -1.5%. 
Hm Treasury -1.9%. 
Agriculture & Rural Affairs -2.3%. 
Foreign & Development -8.3%. 
Asylum -13.1%. 

13 Jun 2025. Chart by Martin Wheatcroft. Design by Sunday. Source: HM Treasury, 'Spending Review 2025'.

The Spending Review 2025 establishes base operating budgets for government departments for the three financial years from 1 April 2026 (2026/27, 2027/28 and 2028/29) and base capital budgets for four financial years (extending to 2029/30).

Departmental budgets for the current financial year ending on 31 March 2026 (2025/26), total £648bn and are expected to rise to £678bn in 2026/27, £697bn in 2027/28, and £717bn in 2028/29, an increase of 10.6% over the three years or 3.4% a year. This is equivalent to an average increase of 1.5% a year in real terms after adjusting for inflation of 1.9% a year on average over the spending review period.

The totals can be analysed between operating or ‘day-to-day’ budgets of £517bn, £536bn, £552bn and £568bn in 2025/26, 2026/27, 2027/28 and 2028/29 respectively and capital budgets of £131bn, £143bn, £145bn and £149bn. These are real terms increases of 1.2% and 2.4% a year on average over three years. 

The capital budget in 2029/30 is £152bn, a cut in real terms that reduces the average annual increase in capital budgets over four years to 1.8% a year on average.

My chart this week highlights how the 1.5% average annual real increase over three years in total budgets (operating and capital) has been allocated across departments, starting with the Ministry of Defence, which leads the pack with an average increase in its budget of 3.8% a year, followed closely by the security services, with an average annual increase of 3.7%. This reflects the elevation of national defence and security to the top of the government’s priorities since the general election last year, even though this increase will only move defence and security spending from 2.3% of GDP currently to 2.6% of GDP by 2027, a long way off the proposed 3.5% of GDP new minimum to be discussed at the NATO summit.

Economic growth and the NHS are the next highest priorities for the government and so it is perhaps unsurprising that the Department of Business & Trade does well with an annual average increase of 3.0%, closely followed by the Department of Health & Social Care, which receives 2.7%. The latter is the biggest increase in cash terms, at £31bn in total or about £12bn more in 2028/29 after adjusting for inflation.

Local government finances are in a parlous state and so the government has pencilled in a 2.6% average annual increase in core budgets for local authorities in England over the next three years. However, it is only increasing central funding by 1.1% a year on average, implying the balance will need to be made by local taxation, principally council tax.

The Ministry of Justice has been awarded 2.0% a year on average as the government seeks to tackle significant backlogs in the courts, overcrowded prisons and significantly under-resourced probation services.

The Department of Science, Innovation and Technology has received a below average annual increase of 0.9% over the next three years, but this follows an almost 12% increase over the past two years as the government has sought to increase investment in research and development to boost economic growth.

Despite being a key priority for the government, the Department for Education has only received a 0.8% average annual increase, partly because of falling primary school rolls in line with a significant fall in the birth rate over the last decade.

The devolved administrations – Scotland (0.8%), Wales (0.7%) and Northern Ireland (0.5%) – are budgeted to receive an average of 0.7% a year over three years as a consequence of the Barnett formula that links UK national government spending in England to the block grants provided to each devolved administration, adjusted for relative changes in population among other factors.

The Cabinet Office is expected to receive just 0.4% on average reflecting the contribution that planned efficiency savings are expected to contribute to administrative budgets. This is also the reason for the 0.2% a year real-terms fall in the Department for Work and Pensions (DWP) budget as automation helps reduce the cost of administering the welfare system.

The budget of the Department for Transport is expected to fall by 0.5% a year overall, but this partly reflects a fall in spending on High Speed 2 as it comes closer to completion. If that is excluded, the department’s budget is expected to increase by 0.5% a year on average. The actual increase in spending should be even higher, as the budget is net of passenger revenues that are expected to grow at a faster rate over the next three years.

Extra money for housing was found within the spending review, but this wasn’t enough to stop the budget for the Department of Housing, Communities and Local Government from shrinking by an annual average of 0.6% a year as other activities are cut back, while the Department for Culture, Media & Sport (-1.4% a year on average) has also been asked to cut back its activities.

HMRC (-1.5% a year) and HM Treasury (-1.9% a year) see their budgets reduced significantly, with digitisation and efficiency savings expected to contribute significant sums.

The Department for Farming, Agriculture, and Rural Affairs (-2.3%) is also expected to see significant cuts over the next three years, as is the Foreign, Commonwealth and Development Office (-8.3%), although in the latter case that is principally driven by the decision to reduce overseas development assistance from 0.5% of GDP to 0.3% of GDP although some will come from back office savings.

Not shown in the chart are small and independent bodies and the government legal function, which are together expected to increase by 0.4% a year on average, although this comprise a -0.5% annual reduction in the former and a 5.3% average annual increase in the latter. The net changes after inflation are a fall of less than £0.1bn and an increase of just over £0.1bn respectively, which are rounding errors in the hundreds and hundreds of billions of pounds spent by government departments each year.