ICAEW chart of the week: Employment costs

My chart for ICAEW this week looks at how employment costs in June 2025 have risen by 4.8% compared with the same month last year, adding to the expense of doing business in the UK.
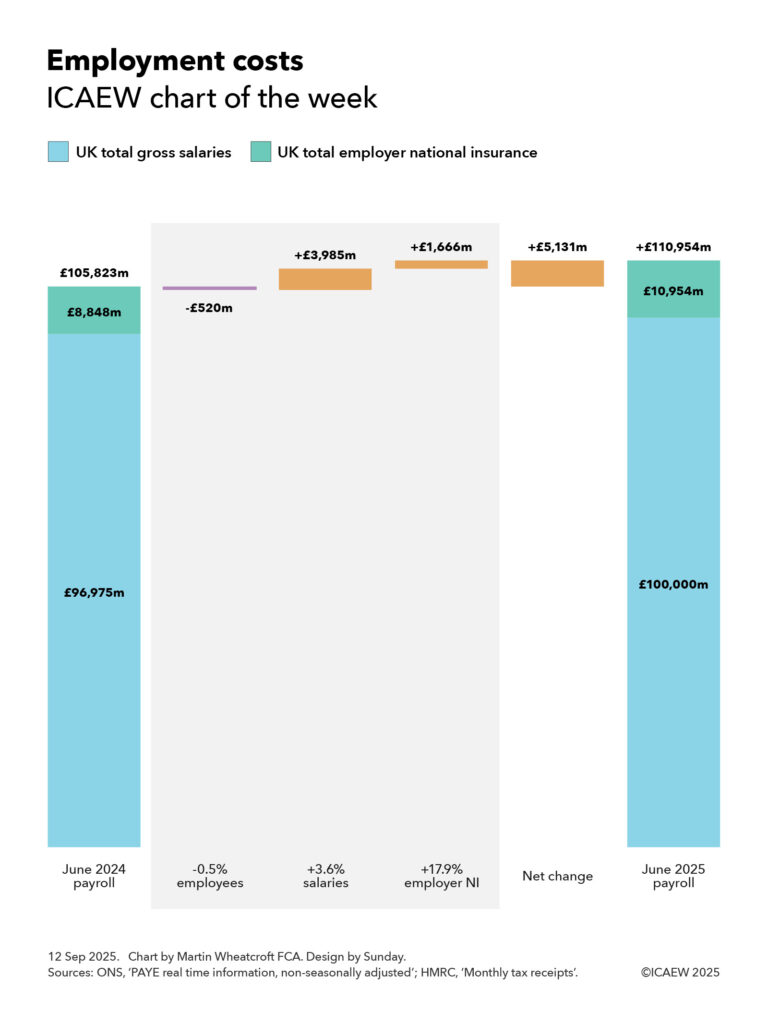
ICAEW chart of the week on employment costs. 

A step chart showing the changes between the UK monthly payroll in June 2024 and June 2025.

June 2024: £96,975m UK total gross salaries + £8,848m UK total employer national insurance.

Step 1: -£520m from 0.5% fewer employees. 
Step 2: +£3,985m from 3.6% increase in salaries. 
Step 3: +£1,666m from 17.9% higher employer national insurance. 

Net change: +£5,131m. 

June 2025: £100,000m UK total gross salaries + £10,954m UK total employer national insurance. 

12 Sep 2025. Chart by Martin Wheatcroft FCA. Sources: ONS, 'PAYE real time information, non-seasonally adjusted'; HMRC, 'Monthly tax receipts'.

According to the Office for National Statistics (ONS) and His Majesty’s Revenue and Customs (HMRC), UK employers paid a total of £111bn in gross salaries and employer national insurance in June 2025, an increase of £5.1bn or 4.8% over the same month a year ago.

My chart this week starts with the payroll in June 2024 of £105,823, comprising gross salaries paid by employers of £96,975m and employer national insurance of £8,848m, although it excludes employer pension contributions.

This monthly cost was reduced by £520m from a reduction in the national workforce, which saw the number of payrolled employees drop by 149,937 or 0.5% from 30,532,600 in June 2024 to 30,382,663 in June 2025. This arose from 7,296,859 leavers exceeding 7,146,922 joiners, most of which are people moving jobs. The reduction in the number of payrolled employees at a time of still-rising overall population numbers highlights the difficult economic situation currently facing the UK. The reduction comprised £476m in less pay and £44m in less employer national insurance (calculated at last year’s rates)

Salary increases since last year of approximately 3.6% added £3,985m or 3.8% to the cost of employment, with mean salaries increasing from £3,176 in the month of June 2024 to £3,291 in the month of June 2025. This comprised an increase of £3,501m or 3.6% in gross salaries and an estimated increase in employer national insurance of £484m or 5.5% (based on last year’s rates).

The median monthly salary increased from £2,389 in June 2024 to £2,530 in June 2025, which is a 5.9% increase compared with a year previously. This was less than monthly pay at the 25th percentile, which increased by 7.8% from £1,408 to £1,518, which was partly driven by a 6.7% increase in the minimum wage implemented in April 2025 (16.3% for those aged 18 to 20 and 18% for those aged under 18) that help lift the salaries of lower paid workers.

Pay at the 75th percentile increased by 4.7% (from £3,632 to £3,803) compared with a year previously, while pay at the 95th and 99th percentiles increased by 3.1% (from £7,461 to £7,692) and 2.6% (from £15,181 to £15,583) respectively. These lower rates of increase for higher paid workers primarily relate to base pay and so do not tell the full story as bonuses and other variable compensation for 2025 will in most cases not show up in pay packets until early next year.

A further £1,666m or 1.5% was added to the total cost of employment as a consequence of changes in employer national insurance effective from April 2025. These took the rate payable by employers from 13.8% of salaries over £792 a month to 15.0% of salaries above £417 per month, adding an extra 17.9% to the amount paid in employer national insurance after taking account of changes in the number of payrolled employees and salary increases since last year. Just under half of the increase (£808m) resulted from the change in the main rate of employer national insurance going up from 13.8% to 15.0% on salaries above £792 a month, with the balance (£858m) coming from lowering the threshold at which the 15.0% applies to £417 per month.

The overall effect was a net increase of £5,131m or 4.8% in total pay and employer national insurance to £110,954m in June 2025, comprising a net increase of £3,025m or 3.1% in total gross salaries to £100,000m and a net increase of £2,106m or 23.8% in employer national insurance to £10,954m.

The chart does not reflect the full cost of employment as it does not include employer pension contributions, non-payrolled benefits, and employment-related costs such as facilities, equipment, training and travel amongst others. However, it still gives a useful illustration of how payroll costs have changed significantly over the course of one year.

ICAEW’s growth campaign identifies how it is too difficult, expensive and uncertain to do business in the UK and calls for the government to do what it can to streamline regulations, reduce unnecessary costs, and provide businesses with the confidence they need to invest.

This chart was originally published by ICAEW.

ICAEW chart of the week: Labour market

My chart for ICAEW this week is on the labour market, breaking down the employment status of the 55.1 million adults aged 16 or over in the UK.

Labour market | 
ICAEW chart of the week | 

‘Treemap’ chart featuring rectangles scaled to the numbers. 

55.1m UK adults aged 16 or over. 

Active: 34.5m (left hand side). 

Private sector employees 22.6m. 
Public sector employees 6.0m. 
Self-employed 4.5m. 
Unemployed 1.5m. 

Inactive: 20.6m (right hand side). 

Inactive 65+ 11.2m. 
Sick 3.0m. 
Students 2.5m. 
Homemakers 1.7m. 
Retired 16-64 1.1m. 
Other 1.1m.    


13 June 2024.   Chart by Martin Wheatcroft FCA. Design by Sunday. 

(C) ICAEW 2024.

Our chart illustrates the employment status of the 55.1m adults in the UK on the basis of the latest statistics reported by the Office for National Statistics (ONS), published on 11 June 2024 for the three months from February to April 2024. The ONS is well ahead of the Labour Party’s proposals to extend the franchise in that it has long classified individuals aged 16 or 17 as ‘adults’ for the purposes of its labour market statistics. 

According to the latest numbers, there are 34.5m economically active individuals in the UK, comprising 22.6m private sector employees, 6.0m public sector employees, 4.4m self-employed and 1.5m unemployed.

A further 20.6m adults are not economically active, comprising 11.2m individuals aged 65 or more (most of whom are retired), 3.0m aged 16-64 who are sick, 2.5m students, 1.7m homemakers, 1.1m who have taken early retirement, and 1.1m others who are either not active for other reasons, or where the reason they are not active is not clear. 

The 2.5m student number excludes 1.2m students and pupils with part-time jobs, who are included within the economically active category.

The inactive total includes 1.7m adults aged 16-64 who don’t meet the criteria to be officially classified as unemployed but say that they would like a job, comprising 0.3m or so students, 0.4m homemakers, 0.7m sick and 0.3m other.

The inactive numbers between age 16 and 64 have been broadly stable over the past few years (plus or minus 0.1m) with the exception of the number who are sick. This has increased from 2.3m (2.1m long-term sick and 0.2m temporarily sick) in the same period in 2020 – at the start of the pandemic – to 3.0m (2.8m long-term sick and 0.2m temporarily sick) today. This is a 32% increase in the number of long-term sick, a major issue both for the economy and the NHS.

The 33.0m people in work include 1.5m who are aged 65 or over, but unfortunately the ONS doesn’t provide a breakdown between those in work who are aged 65 (and therefore still shy of the state retirement age) and those who are aged 66 or more who could retire but have chosen or need to continue working. 

Public sector employees comprise 2.0m in the NHS, 1.5m in education, 1.2m in public administration (including 0.5m in the civil service), 0.4m in the police and armed forces, 0.2m in other health and social work, and 0.7m in other areas.

According to the ONS, the employment rate is 74.3%, being the total of those in work between 16 and 64 (33.0m total – 1.5m over 65 = 31.5m) divided by the total number aged between 16 and 64 (31.5m in work + 1.5m unemployed + 9.4m inactive = 42.4m).  

In contrast, the unemployment rate of 4.4% is calculated including those aged 65 or more but excluding those who are inactive, dividing the just over 1.5m who are officially unemployed (of whom 48,000 are 65 or more) by the just under 34.5m total number of economically active individuals

This chart was originally published by ICAEW.