ICAEW chart of the week: Tax burden rising

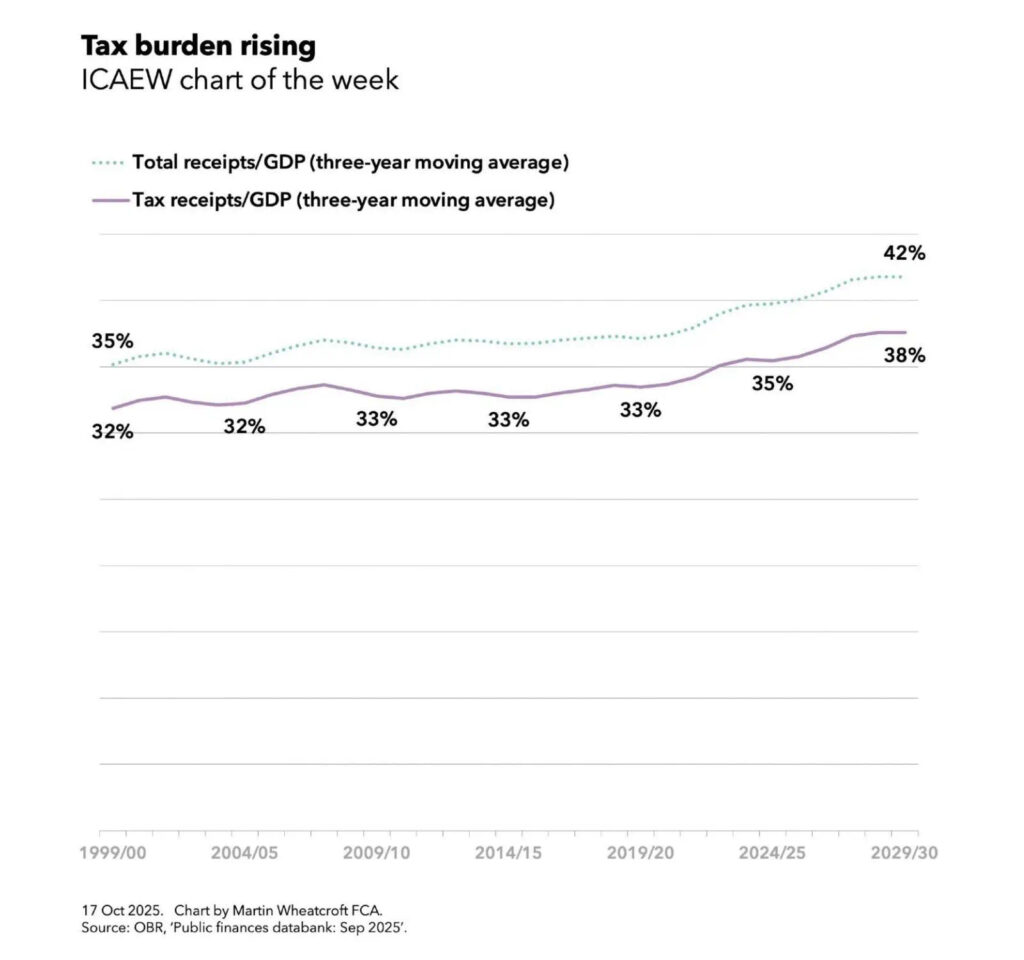
My chart for ICAEW this week shows how tax receipts as a proportion of national income have risen significantly since the turn of the century, begging the question as to whether taxes are too high or the UK economy is too small?
ICAEW chart of the week: Table burden rising. 

A line chart with a solid purple line for tax receipts/GDP (three-year moving average) and a dotted teal line for total receipts/GDP (three-year moving average). 

Tax receipts/GDP (solid purple line) zigs and zags between 32% in 1999/00 to 32% in 2004/05 to 33% in 2009/10 to 33% in 2014/15 to 33% in 2019/20 to 35% in 2024/25 to 38% in 2029/30. 

Total receipts/GDP (dashed teal line) broadly tracks the purple from 35% in 1999/00 to 42% in 2029/30. 

17 Oct 2025. Chart by Martin Wheatcroft FCA. 
Source: OBR, 'Public finances databank: Sep 2025'.

My chart of the week for ICAEW illustrates how tax receipts as a percentage of GDP averaged 32% over the three years to 1999/00, 32% to 2004/05, 33% to 2009/10, 33% to 2014/15, 33% to 2019/20, 35% to 2024/25 and are projected to hit 38% over the three years to 2029/30, based on data from the Office for Budget Responsibilities’ public finances databank for September 2025.

The chart also shows how total receipts including non-tax income averaged 35% in the three years to 1999/00 and a projected 42% to 2029/30.

The one caveat to these percentages is that they do not reflect recent revisions by the Office for National Statistics that increase GDP by the order of 1% across multiple years, which will cause the reported percentages to be a little smaller when they are recalculated by the OBR for the Autumn Budget 2025.

Either way, a projected rise of approaching 20% in the proportion of the economy taken in taxes since the end of last century is pretty significant, even if the projected tax burden will be lower than those of many countries in Europe. 

The chart doesn’t show public spending as a proportion of national income. This averaged 35% of GDP over the three years to 1999/00 and 45% of GDP over the three years to 2024/25, with more people growing older driving up the cost of pensions, health and social care significantly and a much higher bill for debt interest being two of the main factors driving up costs.

Public spending as a share of national income is projected to fall slightly to an average of 44% over the three years to 2029/30 as the government tries to reduce the shortfall between total receipts and spending (aka the deficit) through a combination of higher taxes (as announced in the Autumn Budget 2024) and some constraint in public spending over the next five years.

Unfortunately, a lack of fiscal headroom, a disappointing economic outlook, and cost pressures are now expected to lead the Chancellor to increase taxes even further in the Autumn Budget 2025. This suggests that taxes may be too low, at least if the government is to deliver the level of public services and welfare provision it is committed to.

If taxes are not too high, then the problem must be that the economy is too small. This is evidenced by low productivity growth since the financial crisis and successive economic shocks that have together resulted in a UK economy that has not grown at anywhere near the speed it might have.

If tax cuts are unlikely, at least in the medium-term, the principal route to reduce the tax burden must be to drive up economic growth, as called for in ICAEW’s business growth campaign. This calls for the government to focus on business growth by addressing the many factors that make it too uncertain, too difficult and too expensive to do business in the UK.
This chart was originally published by ICAEW.

ICAEW chart of the week: GDP revisions

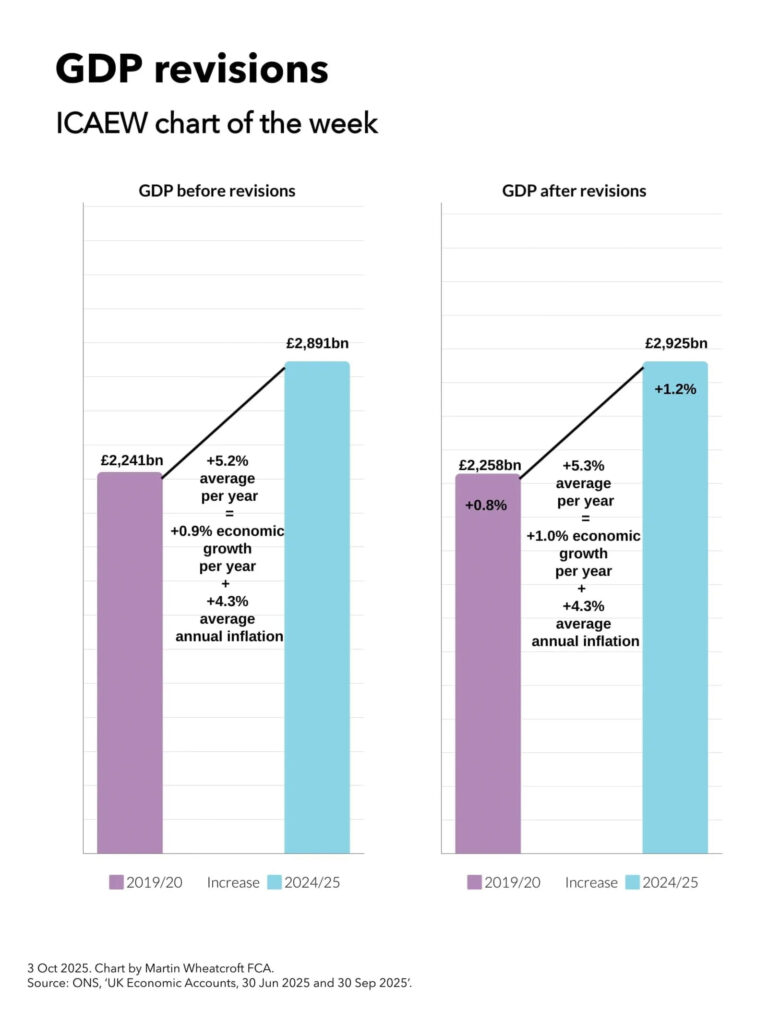
My chart for ICAEW this week looks at how a large upward revision in GDP for 2024/25 translates into a relatively modest 0.1 percentage point increase in economic growth per year since the pandemic.

ICAEW chart of the week: GDP revisions

Side-by-side column charts, each with an upward line showing the increase between the two.

GDP before revisions 

2019/20: £2,241bn. 
Increase: +5.2% average per year = +0.9% economic growth per year + 4.3% average annual inflation. 
2024/25: £2,891bn. 

GDP after revisions:

2019/20: £2,258bn. 
Increase: +5.3% average per year = +1.0% economic growth per year + 4.3% average annual inflation. 
2024/25: £2,925bn. 

3 Oct 2025. Chart by Martin Wheatcroft FCA. 
Source: ONS, 'UK Economic Accounts, 30 Jun 2025 and 30 Sep 2025'.

On 30 September, the Office for National Statistics (ONS) published its latest quarterly GDP statistics for April to June 2025. The headline pointed to a slowdown in quarterly economic growth to 0.3% over that period, down from 0.7% growth in the first quarter of the year. However, more significant was a large revision that increased reported GDP for the year to March 2025 (2024/25) by 1.2%, taking it from £2,891bn to £2,925bn.

The ONS also revised GDP for previous years, including a 0.8% upward revision in reported GDP for 2019/20 from £2,241bn to £2,258bn.

My chart for ICAEW this week illustrates how this resulted in the increase in GDP over the five years to 2024/25, going from an average of 5.2% a year in GDP before revisions, to 5.3% a year after revisions. As inflation is similar before and after the revisions (at an average of 4.3% per year), this means that average annual real economic growth over the past five years has been revised up by 0.1 percentage points from 0.9% a year to 1.0% a year.

While the effect on economic growth over the past five years has been relatively modest, it will knock off at least a percentage point from the public sector net debt to GDP ratio – all without the Chancellor needing to lift a finger.

The statistical revisions reflect the typical process of updating historical numbers for more recent data, such as corporation tax returns that reported higher corporate profits than originally estimated and higher estimates of educational output, business inflation and output of pharmaceutical companies. However, the largest revision was a methodology change that increased the estimate of investment in research and development by approximately 1 percentage point of GDP, bringing the UK more in line with comparable countries in the developed world.

Unfortunately, even with this statistical boost to research and development, the UK still underperforms compared with the US, where economic growth since before the pandemic has been more than twice as fast, as well as lagging (albeit slightly) behind the Eurozone.

ICAEW’s business growth campaign has identified how it has become increasingly too uncertain, too difficult and too expensive to do business in the UK and calls for fundamental reform of tax, regulation and economic policy to support stronger business growth going forward.

Read more in ICAEW’s recommendations on how we can tackle the barriers to improving productivity in our business growth campaign.

For more detail about GDP and the revisions the ONS has made, visit GDP quarterly national accounts: April to June 2025.

This chart was originally published by ICAEW.

ICAEW chart of the week: Productivity

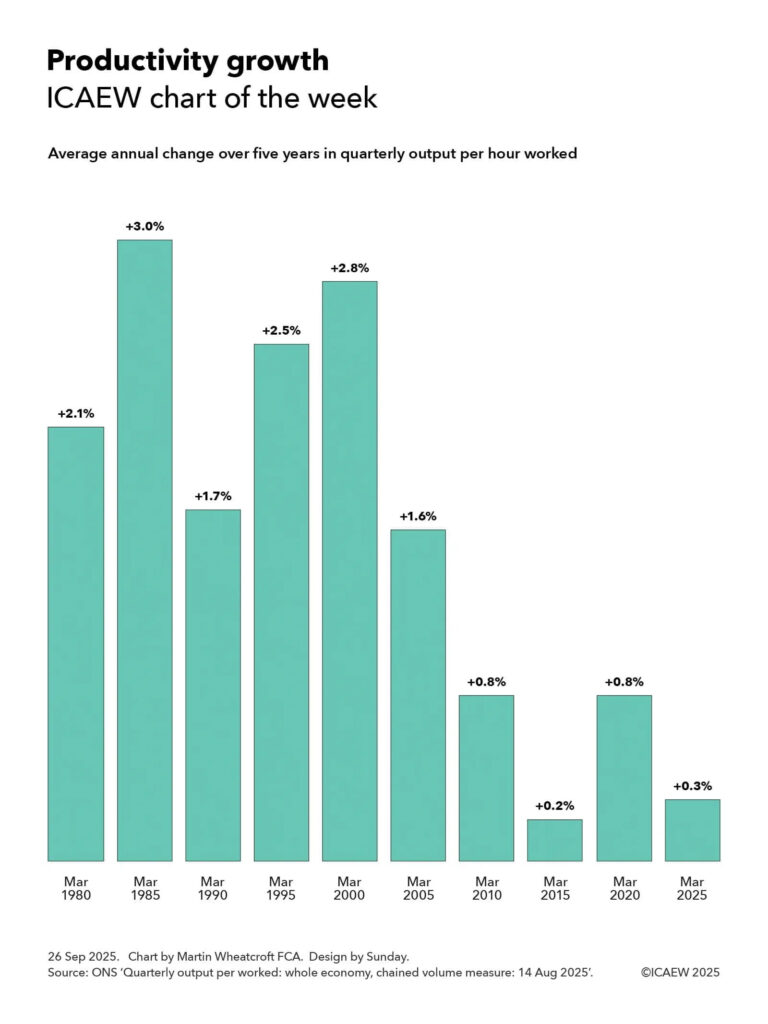
My chart for ICAEW this week looks at how productivity growth has slowed significantly over the past quarter of a century and asks what can be done to turn it around.

ICAEW chart of the week: Productivity growth

Column chart showing the average annual change over five years in quarterly output per hour worked. 

(Five years to) Mar 1980: +2.1% 
Mar 1985: +3.0% 
Mar 1990: +1.7% 
Mar 1995: +2.5% 
Mar 2000: +2.8% 
Mar 2005: +1.6% 
Mar 2010: +0.8% 
Mar 2015: +0.2% 
Mar 2020: +0.8% 
Mar 2025: +0.3% 
 
26 Sep 2025. Chart by Martin Wheatcroft FCA. Design by Sunday. 
Source: ONS, 'Quarterly output per hour worked: whole economy, chained volume measure: 14 Aug 2025'.

One of the biggest challenges facing the UK economy is the decline in productivity growth over the past quarter of a century as illustrated by my chart of the week for ICAEW. This shows how the average annual change over five years in quarterly output per hours worked in March 1980 was the equivalent of 2.1% a year higher than it was in the quarter to March 1975, five years earlier.

The chart also shows how output per hour rose by an annual average of 3.0% a year to March 1985, 1.7% to March 1990, 2.5% to March 1995, and 2.8% to March 2000.

Unfortunately, productivity growth has declined since then with quarterly output per hour increasing by an average of 1.6% a year over the five years to March 2005, 0.8% to March 2010, 0.2% to March 2015, 0.8% to March 2020 and 0.3% to March 2025.

These percentages go a long way to summarising how the UK economy has stalled since the start of the century, especially from the start of the financial crisis in 2007 through the austerity years, Brexit, the pandemic and the energy and cost-of-living crisis. We are producing less value per hour worked even as the population has grown and technology has further advanced.

While the crises we have gone through may partly explain some of the reduction in historical productivity growth over the last quarter of a century, the big question worrying many economists is why productivity has not returned to anywhere close to the levels seen before the turn of the century, or to even to those seen in the USA where, until recently, productivity growth has continued to hold up despite everything.

The Office for Budget Responsibility’s (OBR) most recent economic and fiscal forecast published in March 2025 was based on a central assumption of productivity growth averaging around 1.0% a year over five years to March 2030, significantly lower than the levels seen in the last century. There have been suggestions that the OBR intends to reduce this assumption when it updates its forecasts for the Autumn Budget 2025 in November, adding to the Chancellor’s headaches when she arrives at the despatch box.

One reason for the much lower levels of productivity growth this century may be the demographic change that has resulted in a much higher proportion of the population in retirement and a much older workforce on average. Another may be a question about whether the advent of the smart phone and ‘always on’ connectivity to the office has actually hindered rather than helped people be productive. A further reason could be the increasingly dire state of the public finances with debt rising from less than 35% of GDP in March 2005 to close to 95% of GDP, hampering the government’s ability to deliver the public services we need to thrive, in addition to raising the tax burden to historically high levels. 

However, many of the reasons are likely to be driven by the challenges identified by ICAEW’s business growth campaign. This has identified how it has become increasingly too uncertain, too difficult, and too expensive to do business in the UK and calls for fundamental reform of tax, regulation and economic policy to support stronger business growth going forward.

Read more in ICAEW’s recommendations on how we can tackle the barriers to improving productivity in ICAEW’s business growth campaign.

This chart was originally published by ICAEW.

ICAEW chart of the week: Business confidence dips further

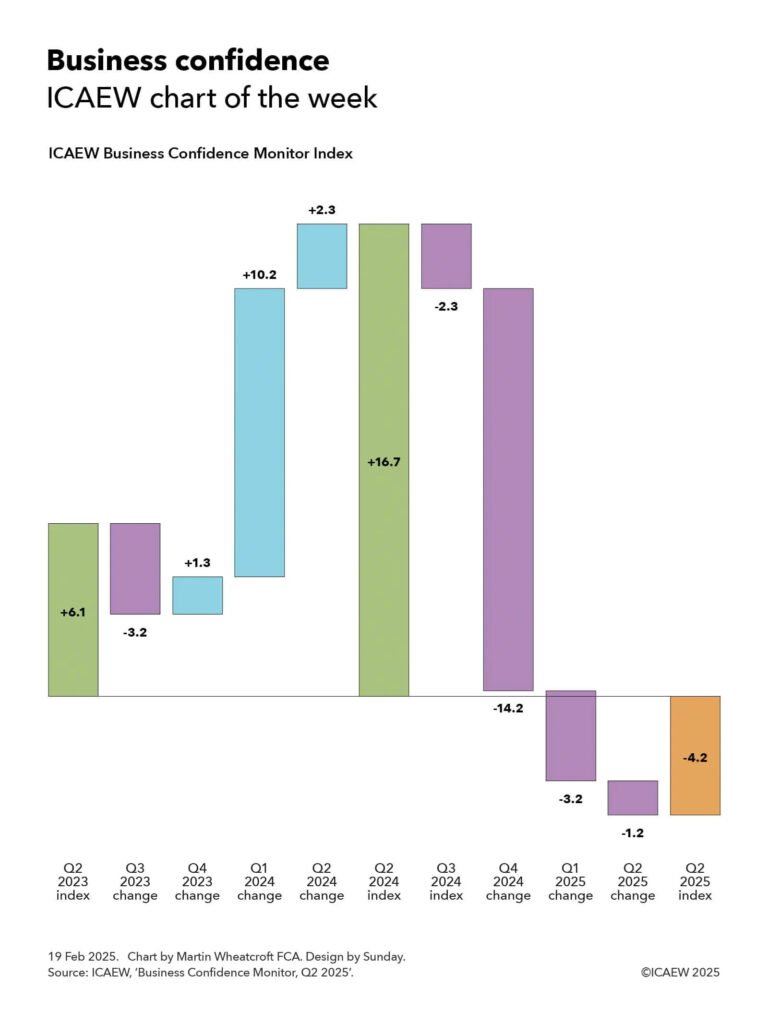
My chart for ICAEW this week looks at how business confidence has entered negative territory, driven by uncertainty about both the economic outlook and potential tax rises.

ICAEW chart of the week: Business confidence 

A step chart showing the quarter-by-quarter change in the ICAEW Business Confidence Monitor Index between Q2 2023, Q2 2024 and Q2 2025. 

Q2 2023 index: +6.1 positive business confidence. 
Q3 2023 change: -3.2. 
Q4 2023 change: +1.3. 
Q1 2024 change: +10.2. 
Q2 2024 change: +2.3. 
= 
Q2 2024 index: +16.7 positive business confidence. 
Q3 2024 change: -2.3. 
Q4 2024 change: -14.2. 
Q1 2025 change: -3.2. 
Q2 2025 change: -1.2. 
= 
Q2 2025 index: -4.2 negative business confidence. 

19 Feb 2025. Chart by Martin Wheatcroft FCA. Design by Sunday. 

Source: ICAEW, 'Business Confidence Monitor, Q2 2025'.

One of the major themes of ICAEW’s growth campaign is how uncertainty for businesses can be tackled in order to improve business sentiment and hence the appetite of businesses to invest. 

My chart for ICAEW this week highlights how business confidence as measured by the ICAEW Business Confidence Monitor (BCM) Index rose from +6.1 in the second quarter 2023 to +16.7 a year later, before crashing over the past year to -4.2 in Q2 2025. 

The +6.1 score in Q2 2023 was a significant improvement over the -20.1 registered half a year earlier in Q4 2022 at the height of the cost-of-living crisis. It was also better than the +4.1 pre-pandemic average and +5.0 overall average measured by the BCM Index. 

As the chart shows, the index declined in Q3 2023 by -3.2 (to 2.9) but then rose by 1.3 in Q4 2023 (to 4.2), by 10.2 in Q1 2024 (to 14.4), and by a further 2.3 in the second quarter of 2024 to reach a peak of 16.7 following the general election and the consequent change in government.

Unfortunately, business sentiment has declined rapidly over the past year, with the BCM Index falling by 2.3 in Q3 2024 (back to 14.4) and by a huge 14.2 in the fourth quarter last year (to 0.2, only just positive). The index turned negative this year with a decline of 3.2 in Q1 2025 (to -3.0) and then a further fall of 1.2 in Q2 2025 to reach a score of -4.2 in the most recent calendar quarter.

According to the BCM commentary, the business sentiment score of -4.2 in Q2 2025 marked a fourth consecutive decline during a period of heightened global uncertainty and weakening UK activity. Confidence among exporters was particularly downbeat, falling into negative territory for the first time in almost three years. 

Domestic sales growth had slowed during the second quarter and businesses had lowered their expectations about domestic and exports sales for the coming year. Concerns about customer demand and competition in the marketplace had risen sharply, while regulatory requirements continued to be the second biggest challenge for businesses.

The tax burden remained the greatest growing challenge in Q2 2025, with the reported rate close to the survey high, and these concerns rose to new record highs in some key sectors.

Expectations for employment growth in the year ahead dropped to the lowest level since Q3 2020, but businesses expected salary growth to continue to ease, adding to the more positive outlook for inflationary pressures than reported in the previous quarter.

Confidence declined in most sectors surveyed and sentiment remained highly unequal, with confidence most negative in manufacturing and engineering, and retail and wholesale; and most positive in information and communication, and construction.

More detail about business confidence by sector and by regions is available in the ICAEW Business Confidence Monitor section of the ICAEW website.

More detail on how it is too difficult, expensive and uncertain to do business in the UK, and ICAEW’s call for the government to do what it can to streamline regulations, reduce unnecessary costs, and provide businesses with the confidence that they need to invest, is available on ICAEW’s growth campaign.

This chart was originally published by ICAEW.

ICAEW chart of the week: Business growth

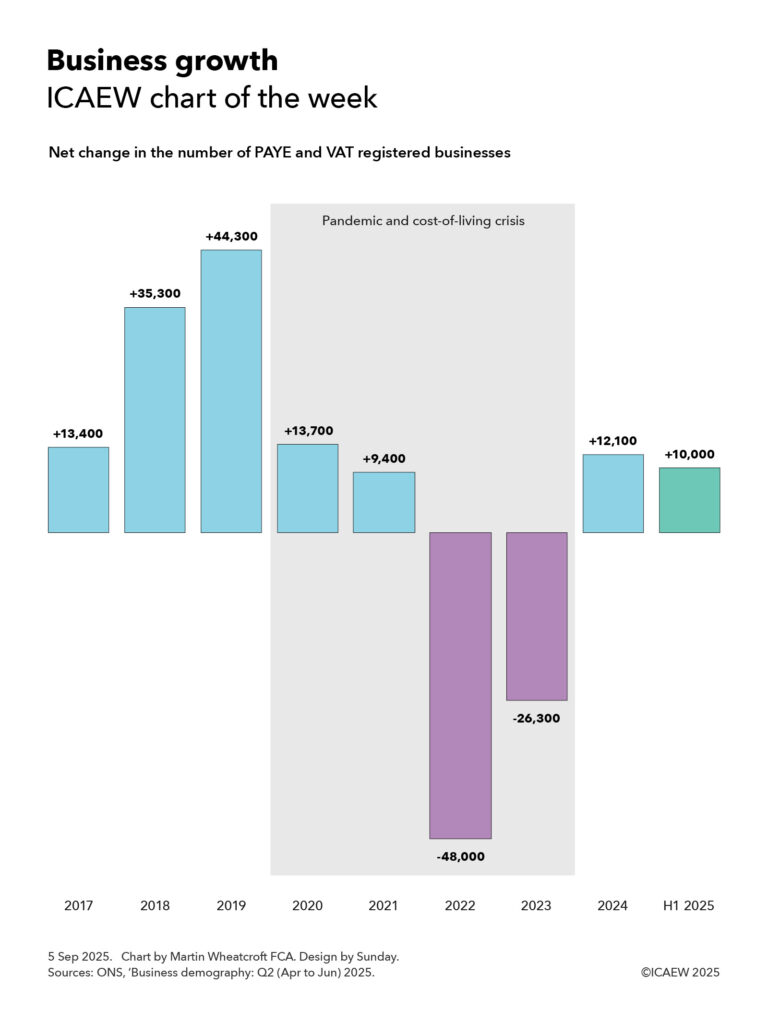
Our chart this week asks whether the recent low rate of growth in numbers of businesses registered for PAYE and VAT is linked to the increasing difficulty of doing business in the UK.

ICAEW chart of the week on business growth, showing the net change in the number of PAYE and VAT registered businesses by year. 

2017: +13,400 
2018: +35,300 
2019: +44,300 
2020: +13,700 
2021: +9,400 
2022: -48,000 
2023: -26,300 
2024: +12,100 
H1 2025: +10,000 

5 Sep 2025. Chart by Martin Wheatcroft FCA. Source: ONS, 'Business demography: Q2 (Apr to Jun) 2025.

According to the Office for National Statistics, there were net additions of approximately 13,400, 35,300 and 44,300 to the UK inter-departmental business register in 2017, 2018 and 2019 respectively. This was followed by net additions of 13,700 and 9,400 in 2020 and 2021 during the pandemic and then net reductions of 48,000 and 26,300 in 2022 and 2023 during the cost-of-living crisis.

The register started growing again in 2024 with net additions of 12,100, followed by a net increase of approximately 10,000 in the first half of 2025. This rate of increase is significantly lower than the average rate of net business formation before the pandemic but is a significant improvement over the net contraction in the number of businesses in 2022 and 2023 during the cost-of-living crisis.

The net changes are equivalent to 0.5%, 1.3%, 1.6%, 0.5%, 0.3%, -1.7%, -1.0% and 0.4% in the total number of registered businesses in 2017 to 2024 respectively and annualised growth of 0.7% in the first half of 2025.

The total number of PAYE and VAT registered businesses is projected to have reached around 2.75m in June 2025, based on the last published count for March 2024 plus reported movements since then. This is out of an overall total of somewhere in the region of 5.5m businesses in the UK, with the difference mainly due to single-person companies and sole traders that do not employ any staff and operate below the VAT threshold of £90,000 per year.

The approximately 2.75m registered businesses can be analysed into just under 2.1m companies and other types of corporations, approximately 400,000 sole proprietors, 150,000 or so partnerships, and around 100,000 non-profit bodies, mutual associations and public sector organisations. Approximately 945,000 registered businesses are in London and the South East, 675,000 are in the Midlands and the East of England, 535,000 in the North of England, 340,000 in the South West of England and Wales, 175,000 in Scotland, and 80,000 in Northern Ireland.

Business births between 2017 and 2024 were approximately: 338,700; 341,100; 355,700; 322,000; 354,300; 327,500; 307,100; and 310,100; there were 167,600 in the first half of 2025. Business deaths in 2017 to 2024 were: 325,300; 304,800; 311,400; 308,300; 344,900; 375,500; 333,400; and 298,000; with 157,600 in the first half of 2025.

The overall change in the total number of registered businesses between 2017 and the first half of 2025 was 63,900, an average of 7,500 or 0.3% a year over eight and a half years, comprising an annual average of 332,100 business births less 324,600 business deaths in that time.

The chart highlights both the very difficult economic times we have been through in the past few years with the pandemic and cost-of-living crisis and the current period of weak economic growth that has yet to return to pre-pandemic levels.

One of the key ways that we can increase the rate of net business formation is to make it easier to do business in the UK, as discussed in ICAEW’s growth campaign. This asks why it is too difficult, too expensive and too uncertain to do business in the UK today and suggests ways the government can streamline regulation, reduce costs and unnecessary frictions, and provide businesses with greater confidence to invest and grow.

This chart was originally published by ICAEW.

ICAEW chart of the week: Quarterly GDP over three years

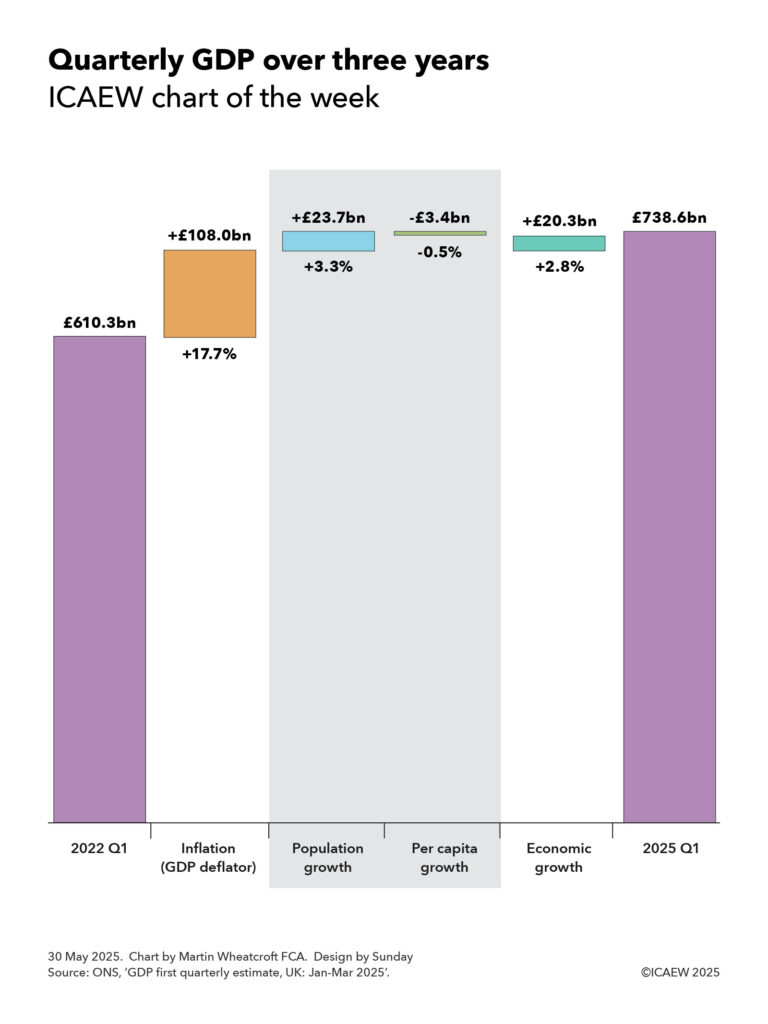
Our chart this week looks at how quarterly GDP has risen from £610.3bn in the first quarter of 2022 to £738.6bn in the first quarter of 2025.

A step chart showing the change in quarterly GDP over the last three years. 
 
Left hand column: Quarterly GDP in 2022 of £610.3bn. 
 
Step 1: Inflation (GDP deflator) +£108.0bn or +17.7%. 
 
Step 4: Economic growth +£20.3bn or +2.8%. 
 
Right hand column: Quarterly GDP in 2025 Q1 of £738.6bn. 
 
Shaded box in the middle of the chart for steps 2 and 3 which are a breakdown of step 4. 
 
Step 2: Population growth +£23.7bn or +3.3bn. 
 
Step 3: Per capita economic growth -£3.4bn or -0.5%. 
 
30 May 2025. Chart by Martin Wheatcroft FCA. Design by Sunday. Source: ONS, 'GDP first quarterly estimate, UK: Jan-Mar 2025'.

According to the Office for National Statistics (ONS), GDP was £738.6bn in the quarter from January to March 2025, £128.3bn or 21.0% higher than the £610.3bn reported for the same quarter three years ago.

Our chart of the week illustrates how quarterly GDP was £108.0bn or +17.7% higher in the first quarter of 2025 compared with the same quarter in 2022 as a result of inflation (using the GDP deflator measure) while economic growth contributed a further £20.3bn or +2.8%. 

The chart also breaks down economic growth over the past three years between a contribution from there being more people of £23.7bn or +3.3% and a decline in economic activity per person of £3.4bn or -0.5%.

Not shown on the chart are the changes by year, which comprised annual inflation of +8.2%, +4.1% and +4.5% and annual economic growth of +0.8%, +0.7% and +1.3% in 2022/23, 2023/24 and 2024/25 respectively, with the latter split between annual population growth of +1.2%, +1.1% and +1.0%, and annual per capita economic growth of -0.4%, -0.4% and +0.3%. 

Also not shown in the chart is economic growth over the last four quarters, which was +0.5%, +0.0%, +0.1% and +0.7% between the first and second quarters of 2024, the second and third quarters, the third and fourth quarters, and the fourth quarter of 2024 and the first quarter of 2025 respectively. These comprised quarterly population growth of +0.3%, +0.2%, +0.2% and +0.2% and quarterly per capita economic growth of +0.2%, -0.2%, -0.1% and +0.5%.

Lower levels of net inward migration are expected to reduce the rate of population growth over the next three years to closer to 0.5% a year, which means that growing the economy faster than inflation will depend on our ability to improve productivity and hence increase real economic activity per person. 

In theory, that should be eminently possible given how per capita economic growth averaged 2.4% per year for the 50 years before the financial crisis. Unfortunately, with per capita growth averaging just 0.6% a year over the past decade, productivity will need to increase significantly if we are to turn the situation around over the coming decade.

The good news is that a 21% increase in GDP means tax receipts should be that much higher. The bad news is that public spending has been going up, too.

This chart was originally published by ICAEW.

ICAEW chart of the week: Economic outlook

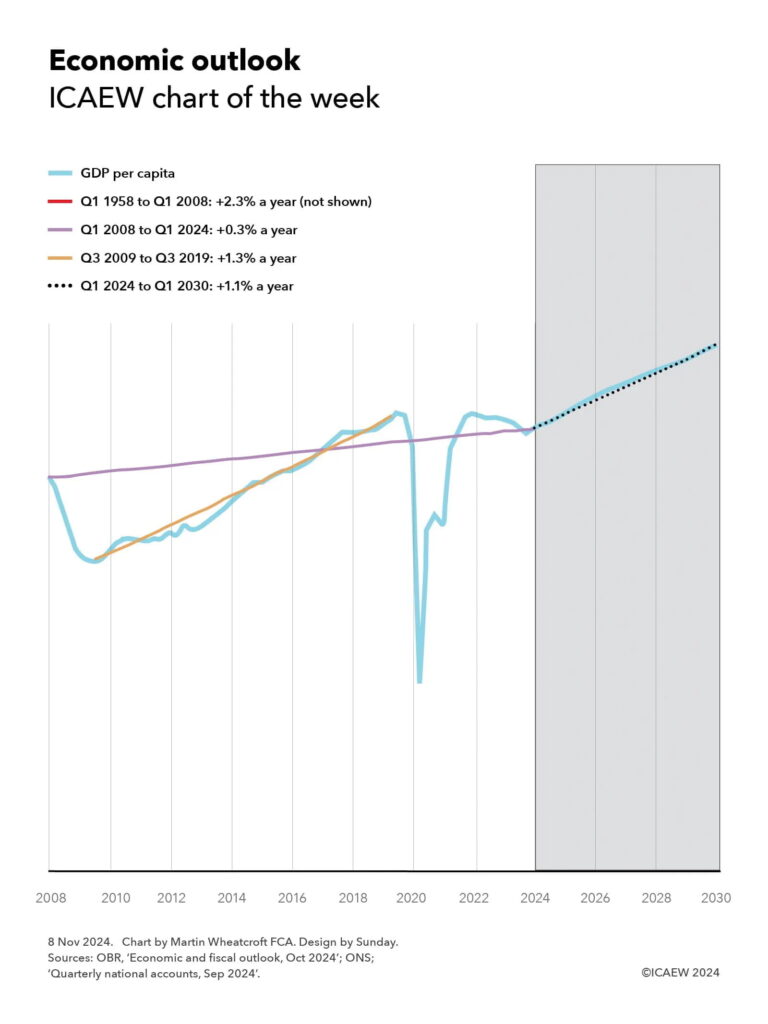
My chart for ICAEW this week looks at how the OBR is forecasting growth in economic activity per person of 1.1% a year between 2024 and 2030. While better than the average of 0.3% a year achieved over the past 16 years, it is significantly lower than the 2.3% a year seen in the 50 years before that.

Line chart showing GDP per capita between Q1 2008 and Q1 2030, with the forecast period from Q1 2024 onwards shaded grey.

GDP per capita - blue line falling from 2008 to 2010 then rising unevenly to 2019 falling hugely in 2020 then rising again to just below 2019 in 2021 before falling to 2024 and then a projected rise from 2024 onwards.

Trend lines overlaid as follows: 
Q1 1958 to Q1 2008: +2.3% a year (not shown in the chart). 
Q1 2008 to Q1 2024: +0,3% a year (purple). 
Q1 2009 to Q3 2019: +1.3% a year (yellow). 
Q1 2024 to Q1 2030: +1.1% a year (dotted black line).

My chart of the week is on the economic projections calculated by the Office for Budget Responsibility (OBR) in its October 2024 economic and fiscal outlook that accompanied the Autumn Budget 2024.

This assumption is a key driver for the OBR’s fiscal projections for tax receipts between now and March 2030, and hence how much the government will need to borrow to finance the current deficit and its investment plans.

The chart starts in March 2008 at the height of the financial crisis, illustrating how economic activity per person after adjusting for inflation fell significantly until September 2009. Real GDP per capita then grew at an average rate of 1.3% a year until September 2019, before the rollercoaster ride that saw the economy collapse during the pandemic, recover and then slide back during the energy crisis. A small uptick in the first quarter of 2024 is hardly noticeable.

The result was that real GDP per capita was only 4.4% higher in March 2024 than it was in March 2008, the equivalent of 0.3% a year on average over 16 years.

The OBR has been more optimistic for the current financial year up until March 2030, predicting per capita economic growth of 1.1% a year on average between the first quarter of 2024 and the first quarter of 2030.

This is of course much better than the 0.3% average increase over the past 16 years, but it is below the 1.3% growth in real GDP per capita during the ‘austerity years’ following the financial crisis and is substantially below the 2.3% average increase over the 50 years prior to the financial crisis.

From a ‘glass half empty’ perspective, this emphasises just how poorly the UK economy has performed since the financial crisis and the challenges the incoming government has in trying to improve productivity and economic output, even without the risk of an economic shock, events that appear to occur every decade or so.

However, those with a ‘glass half full’ temperament will be more cheerful. After all, there does appear to be substantial space for economic growth to improve from the OBR’s less-than-sparkling predictions, even without returning to the heady days of the pre-financial crisis long-term trend.

This chart was originally published by ICAEW.

ICAEW chart of the week: South Korea

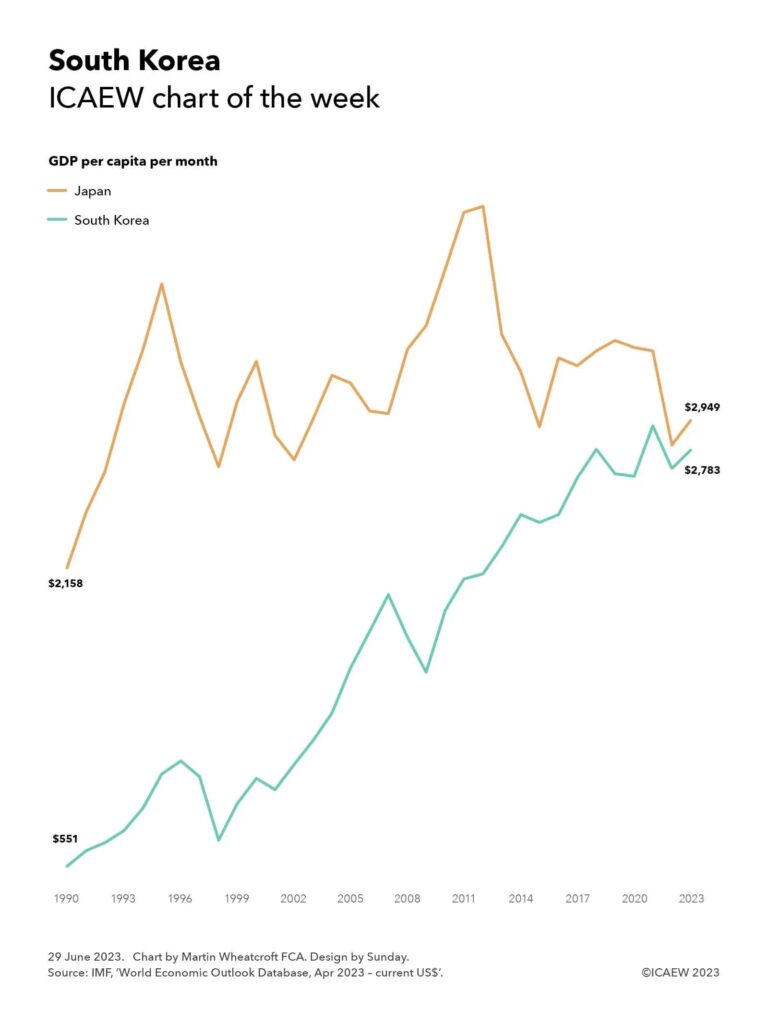
My chart this week looks at the economic success story of South Korea over the last 30 years or so, using Japan as a comparator.

Line chart showing GDP per capita in current US$ between 1990 and 2023.

Japan $2,158 in 1990, steady up to 1995 then zigzags ups and down and up and down and up to a peak in 2012 before falling to 2015 then up then flattish then down and then up to $2,949 in 2023.

South Korea $551 in 1990, steady up to 1996, then down to 1998 then up then down then steady up to 2007, then down to 2009, then zig zag up to 2021, then down, then up to $2,783 in 2023.

The news that South Korea, to align with most of the rest of the world, is cutting the age of its citizens by a year or two – it used to deem a baby one year old at birth, and add a year on 1 January – prompted us to take a look at this peninsula nation and its amazing economic success story.

As my chart this week illustrates, GDP per capita in 1990 in South Korea was $551 per month in then current US$, approximately one quarter of its neighbour Japan’s GDP per capita per month at that time of $2,158

South Korea has seen its economy grow pretty strongly over the last three decades to reach a forecast GDP of $2,783 per person per month for the current year according to the International Monetary Fund (IMF). This is only a little below the economic activity of $2,949 per person per month anticipated to be generated by Japan in 2023. 

South Korea has made steady economic progress since 1990. Outside of recessions and pandemics there have been continual improvements in economic activity and in living standards, resulting in the country moving from the developing nation category to an advanced economy.

This compares with the economic performance of neighbouring Japan, which has been on an economic rollercoaster since the end of the economic boom in the mid-1990s. While a strong currency in the run-up to the global financial crisis boosted the size of its economy in US dollar terms, Japan has subsequently underperformed as its ageing population and lack of immigration has caused its economy to slow and the Yen to fall.

Not shown in the chart is the progress made in purchasing power parity (PPP) international dollars, the measure that economists prefer to use when comparing economic performance between countries as it takes account of differences in living costs. This would show a narrower difference in 1990, when South Korean and Japanese GDP per capita per month were 629 and 1,692 international dollars respectively, and would also show South Korea outgrowing Japan with GDP per capita per month in 2023 of 4,725 international dollars, compared with 4,317 international dollars for Japan.

Many South Koreans waking up on Wednesday 28 June 2023 will have been pretty happy to discover they are now a year or two younger than they were the day before. They may be less likely to reflect on the economic miracle that has taken their country from the depths of extreme poverty in the early 1950s, following the Korean War, to becoming the prosperous nation that South Korea is today. 

This chart was originally published by ICAEW.

ICAEW chart of the week: G7 economic growth

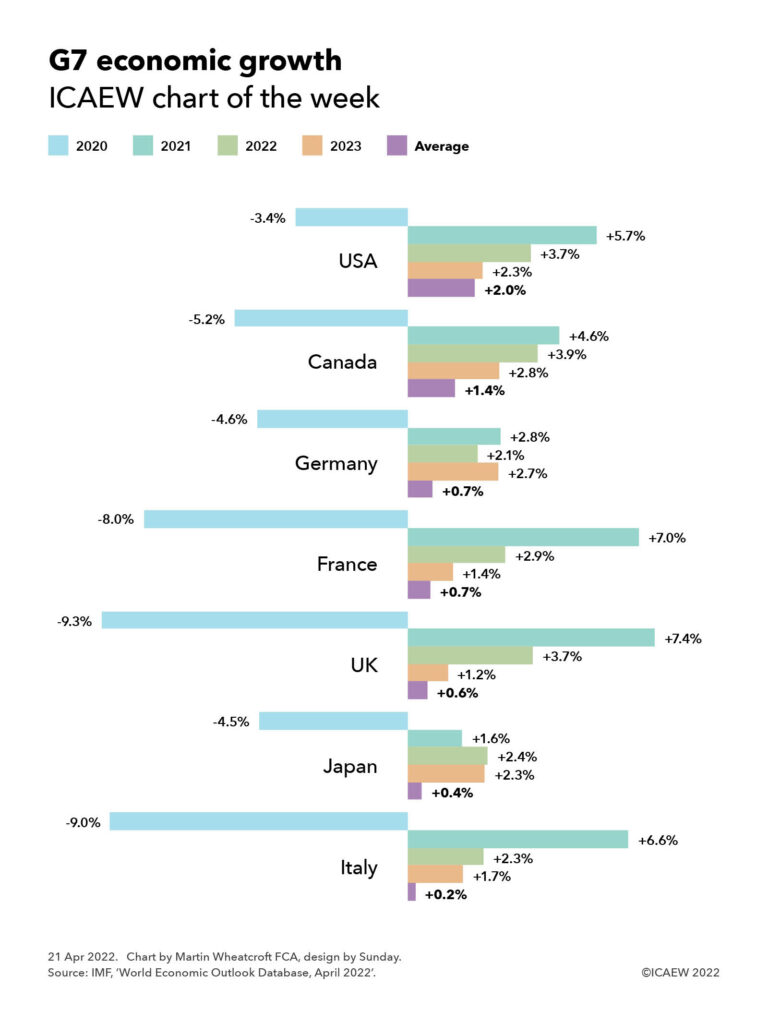
The latest IMF economic forecasts put the UK at the bottom of the pile in 2023, but our chart this week elevates the UK to fifth place out of seven by looking at average growth for the four years from 2020 to 2023.

Chart presenting economic growth for the G7 in 2020, 2021, 2022, 2023 and the average over four years.

USA: -3.4%, +5.7%, +3.7%, +2.3%, average +2.0%
Canada: -5.2%, +4.6%, +3.9%, +2.8%, average +1.4%
Germany: -4.6%, +2.8%, +2.1%, +2.7%, average +0.7%
France: -8.0%, +7.0%, +2.9%, +1.4%, average +0.7%
UK: -9.3%, +7.4%, +3.7%, +1.2%, average +0.6%
Japan: -4.5%, +1.6%, +2.4%, +2.3%, average +0.4%
Italy: -9.0%, +6.6%, +2.3%, +1.7%, average +0.2%

Recent media reports have contrasted the government’s boast of being the best performing economy in the G7 in 2021 with the latest forecasts from International Monetary Fund (IMF) that suggest the UK economy will be bottom of the same league in 2023. Our chart this week attempts to take a step back and look at the overall picture by illustrative average economic growth by the G7 nations over the four years between 2020 and 2023.

These numbers are based on the IMF’s World Economic Outlook and the accompanying World Economic Outlook Database that were published on 19 April, setting out economic forecasts for the world economy over the next few years.

According to the IMF, the USA is the best performing economy in the G7, with average annual economic growth of +2.0% over the period from 2020 to 2023. An economic contraction of 3.4% in 2020 was more than offset by a rebound of 5.7% in 2021, followed by forecast growth of 3.7% in 2022 and 2.3% in 2023. Canada is not far behind, with an average growth of 1.4% over the four years, comprising respectively -5.2%, +4.6%, +3.9% and +2.8% in 2020, 2021, 2022 and 2023.

Germany and France fare pretty similarly to each other, with Germany projected to experience marginally above 0.7% average growth and France marginally below. The patterns are different, however, with Germany having suffered a less severe economic hit during 2020 followed by moderate growth (-4.6%, +2.8%, +2.1%, 2.7%), while France was hit much harder by the pandemic followed by a much stronger rebound before a return to lower growth in 2023 (-8.0%, +7.0%, +2.9%, +1.4%).

The UK is in fifth place in this league table, but at 0.6% average economic growth over the four years selected this is only slightly less than Germany and France. With an economic contraction in 2020 of 9.3%, the UK suffered more severely from the pandemic than the other members in the G7 (although this is partly because of differences in statistical methodologies) but then saw the biggest rebound in 2021 with growth of 7.4%. Growth this year is forecast by the IMF to be 3.7% before falling to an (unfortunately) more typical level of 1.2% in 2023.

Vying for the wooden spoon are Japan and Italy, with Japan continuing a long period of low growth and a slower recovery from the pandemic than the others to average 0.4% a year (-4.5%, +1.6%, +2.4%, +2.3%). Italy secured the bottom position by virtue of being hit hardest by the pandemic and having less of a rebound than others (-9.0%, +6.6%, +2.3%, +1.7%), a net average growth rate of 0.2% over the four-year period.

For those that follow this particular league table, there is a hope that slightly stronger growth than the IMF has forecast could move the UK up one or two places above France and/or Germany. However, the bigger concern for most of us is about the downside risks to the global and UK economies from the war in Ukraine, rampant inflation, and a global cost of living crisis. These may put back even further any hope of returning the UK and other developed economies to a pre-financial crisis path of moderate economic growth.

This chart was originally published by ICAEW.