This week’s chart for ICAEW illustrates how a £205bn surplus on trade in services was offset by a £243bn deficit on trade in goods to result in a net trade deficit of £38bn in 2025 – or £16bn if trade in precious metals is excluded.
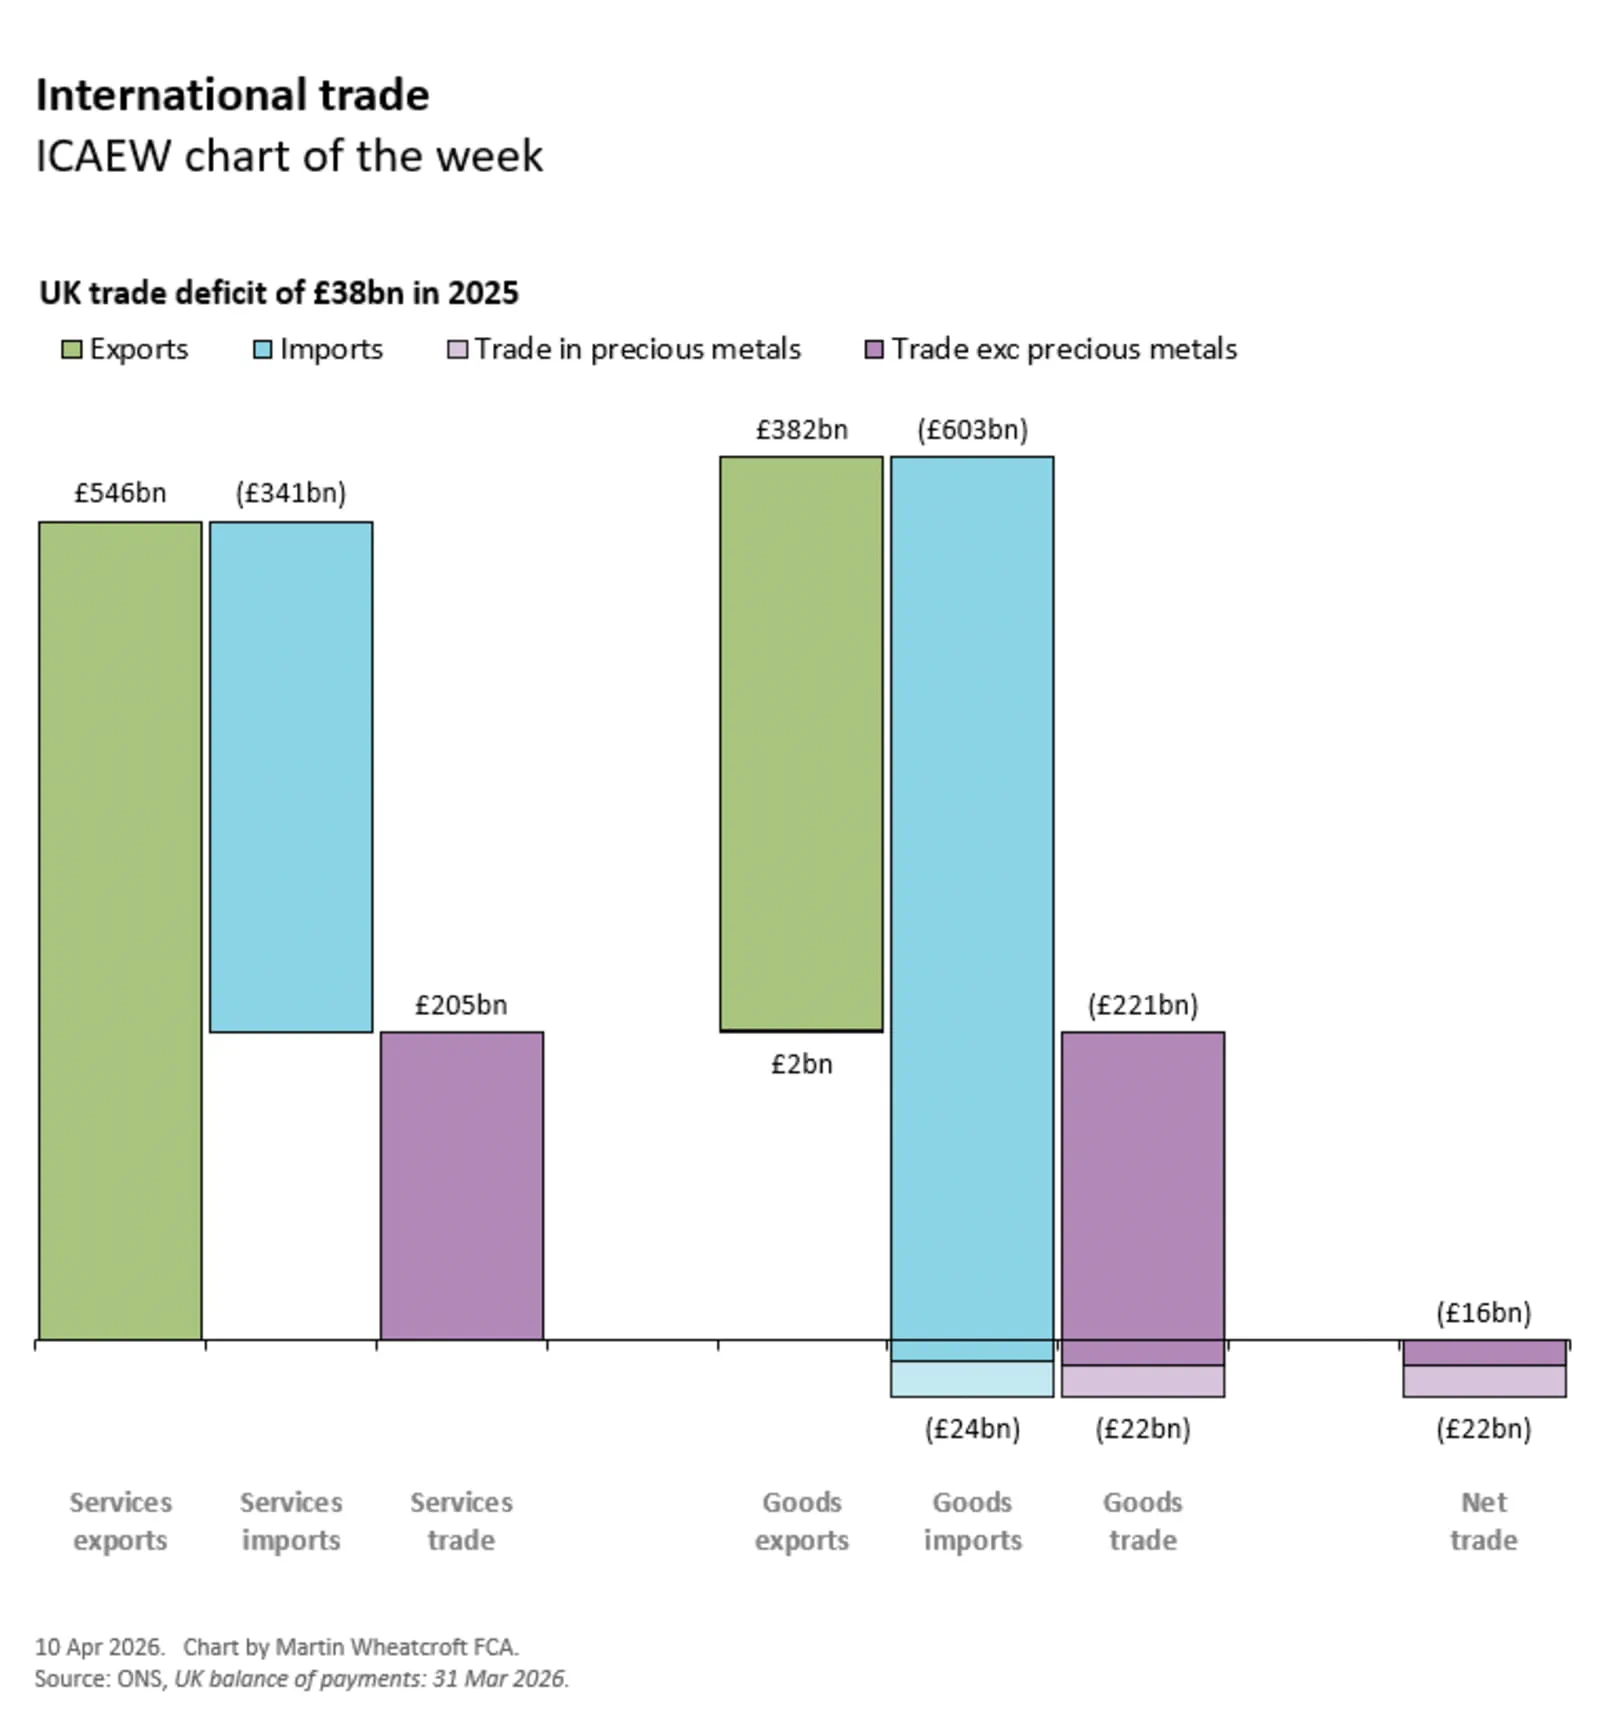
My chart this week for ICAEW is on the principal components of the UK’s £38bn trade deficit in the 2025 calendar year.
The chart starts with a £205bn surplus on trade in services (comprising a £546bn cash inflow from services exports less a £346bn cash outflow to pay for services imports) followed by a £221bn deficit on trade in goods excluding precious metals (comprising £382bn generated from goods exports less £603bn to pay for goods imports), and a £22bn deficit on trade in precious metals (comprising £2bn from exports less £24bn on imports).
Together these result in an overall trade deficit of £38bn, of which £16bn is a deficit on trade in goods and services excluding precious metals and £22bn relates to precious metals.
This is equivalent to a net trade deficit of 1.3% of GDP, comprising a surplus on trade in services of 6.7% of GDP (17.9% from exports – 11.2% on imports) less a deficit on trade in goods excluding precious metals of 7.3% of GDP (12.6% from exports – 19.9% on imports) and a deficit on trade in precious metals of 0.7% of GDP (0.1% from exports – 0.8% on imports).
The ONS publishes trade statistics that exclude precious metals because a large proportion of the value of this trade are sales and purchases of gold between UK and international holders that are really financial flows, often without any physical movement of the gold concerned. Not only can the volume and value of such transactions be quite volatile, but the trade deficit excluding precious metals of £16bn in 2025 is probably more representative of trade flows in that year than the overall trade deficit of £38bn.
The balance of payments
Not shown in the chart are the other components of the current account deficit of £74bn in 2025 and a capital account deficit of £5bn.
The former comprised a primary income or ‘earnings’ deficit of £19bn (being £417bn investment income coming to the UK and £2bn foreign compensation of UK-based employees less £435bn investment income going abroad and £3bn compensation of foreign employees) and a secondary income deficit or ‘net transfers’ of £17bn (£1bn UK government receipts £1bn and £30bn remittances and other inward transfers less £12bn UK government payments abroad and £36bn remittances and other outward transfers) in addition to the trade deficit of £38bn. The latter consisted of £2bn from international sales of non-produced non-financial assets less £7bn in purchases.
The chart also doesn’t show the £79bn surplus in 2025 on the other side of the balance of payments, being an £86bn surplus on financial transactions (£678bn in financial investments in the UK less £592bn in outbound financial investments) less £7bn in statistical errors and omissions.
The trade deficit over time
The trade deficits excluding precious metals of £17bn in 2024 and £16bn in 2025 were a little lower than the £24bn average over the last quarter of a century and were less than the net £19bn average over the previous four years that were distorted by the pandemic and the energy crisis (trade surpluses excluding precious metals of £14bn and £7bn in 2020 and 2021 followed by deficits of £50bn and £47bn in 2022 and 2023).
Whether you think the trade deficit is good or bad depends on your perspective, with some worried about the net cash outflows that result from payments for imports exceeding receipts from exports. Others points to the net positive inflows of goods and services that are coming into the UK in exchange for the money that we spend.
Either way, what we sell abroad and what we buy from overseas are important not only to UK businesses that trade internationally but also to all of us living in the UK.