ICAEW chart of the week: Railway journeys

This week’s chart illustrates how railway strikes are not the only problem facing Great British Railways, the new publicly owned body being established to run the rail network from next April.

Column chart showing railway journeys in Great Britain by quarter from Q1 of 2018/19 to Q4 of 2021/22 split between season tickets; peak, anytime and advance; and off-peak and other. See text below for numbers.

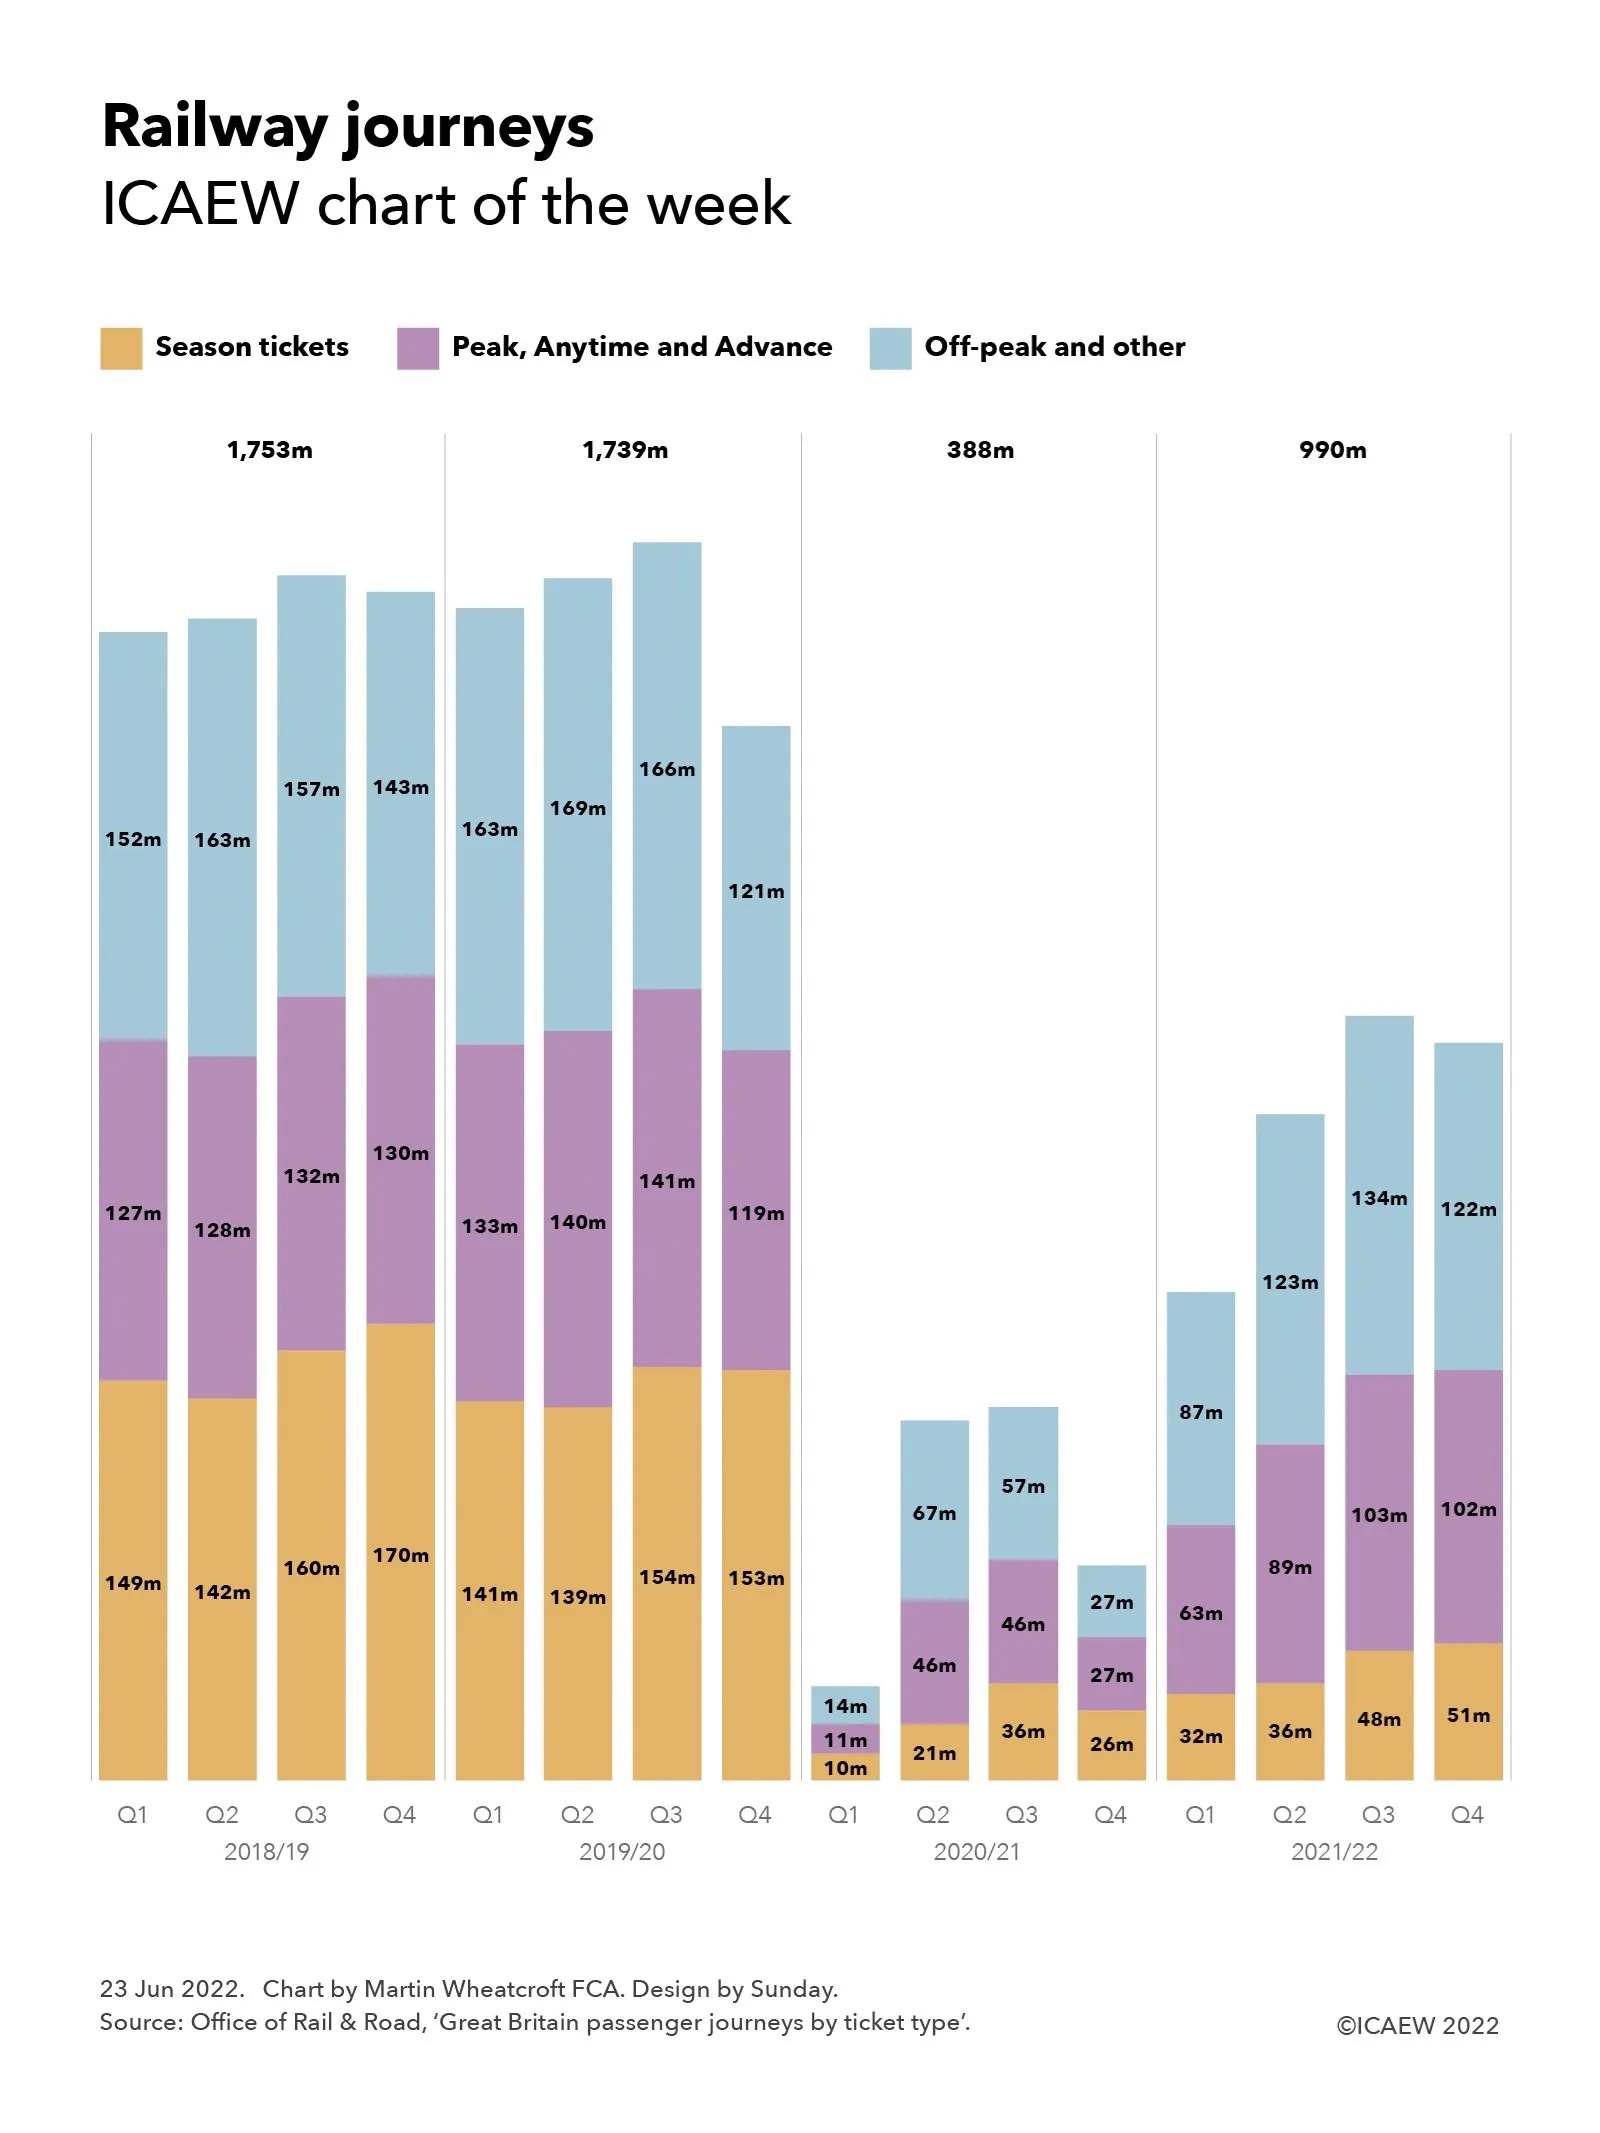
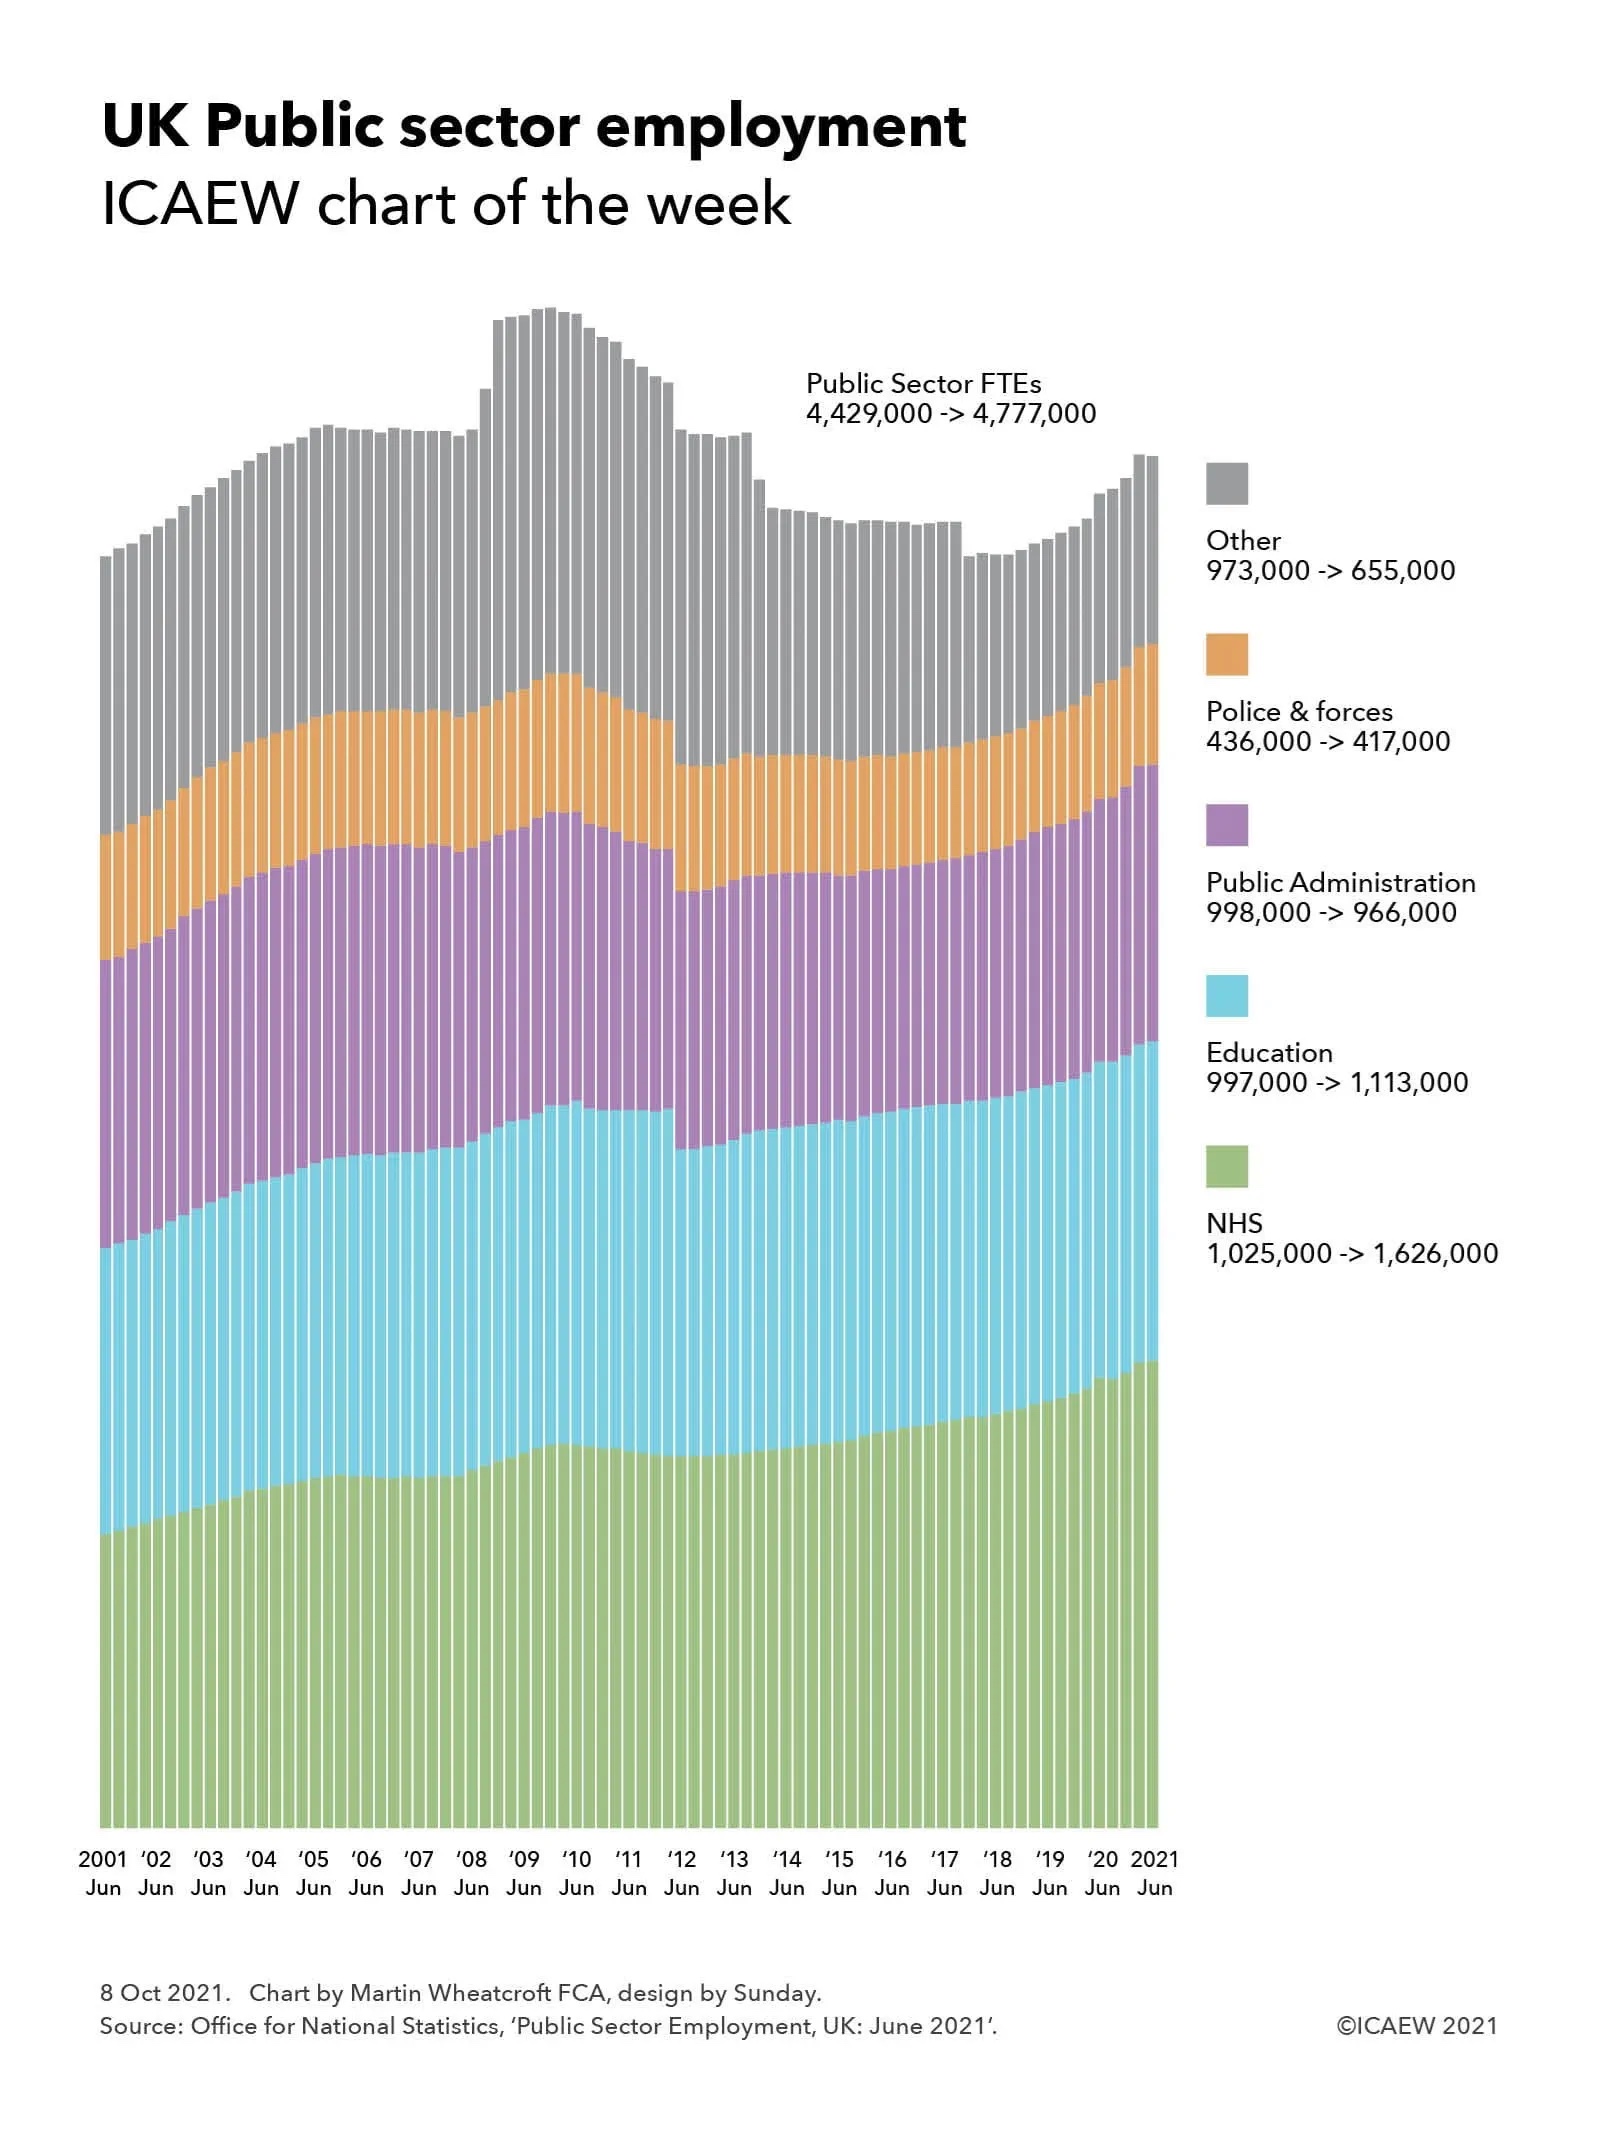
The ICAEW chart of the week is on railway journeys in Great Britain over the past four financial years, highlighting how the number of trips on the network have fallen from a peak of 1,753m in 2018/19 to 1,739m in 2019/20 and 388m in 2020/21, before increasing to 990m in the most recent financial year ended 31 March 2022. These numbers exclude London Underground and light rail and tram systems in London and elsewhere, but they include London Overground.

Passenger numbers are well below pre-pandemic levels – a challenge with a government increasingly reluctant to plug the gap in passenger revenues with additional subsidies on an ongoing basis.

The biggest fall has been in trips using Season tickets, which at 51m during January through March 2022 were 70% below the 170m reported for the fourth quarter of 2018/19. Trips using Peak, Anytime and Advance tickets and Off-peak and other tickets in Q4 of 2021/22 were 22% and 15% down on the quarter ended 31 March 2019. The chart illustrates how travel patterns have changed as many more people work from home on a regular basis, especially regular commuters who have traditionally formed the backbone of rail passenger traffic.

These falls in usage – and in the associated revenue from ticket sales and other income – are likely to present a huge challenge for Great British Railways, the new public body scheduled to take over the running of the railways in England, Wales and Scotland from 1 April 2023 (not including Transport for London and light rail and tram systems). 

Great British Railways is taking on responsibility for the track and stations currently owned by Network Rail and for the running of train services too – with the train operating companies engaged to run services on its behalf under concession arrangements that expose the taxpayer to revenue risk. A difficult enough task at the best of times, but one made even more challenging by the consequences of the pandemic and with a shareholder in the form of a government keen to cut subsidies that have ballooned since the start of the pandemic.

As the chart shows, trips using Season tickets by quarter were 149m, 142m, 160m and 170m in 2018/19; 141m, 139m, 154m and 153m in 2019/20; 10m, 21m, 36m and 26m in 2020/21; and 32m, 36m, 48m and 51m in 2021/22. Trips using Peak, Anytime and Advance tickets were 127m, 128m, 132m and 130m in 2018/19; 133m, 140m, 141m and 119m in 2019/20; 11m, 46m, 46m and 27m in 2020/21; and 63m, 89m, 103m and 102m during 2021/22. Trips using Off-peak and other tickets were 152m, 163m, 157m and 143m in 2018/19; 163m, 169m, 166m and 121m in 2019/20; 14m, 67m, 57m and 27m in 2020/21; and 87m, 123m, 134m and 122m in 2021/22.

The recent strikes won’t help, especially if they recur over the summer. However, whatever happens, getting people back to using the railways is going to be a big task for the new team at Great British Railways – whether by persuading workers to return to the office, encouraging people out of their cars or by just enticing us all to let the train take the strain more often than we do at the moment.

This chart was originally published by ICAEW.

ICAEW chart of the week: UK public sector employment

Our chart this week is on public sector employment, the cost of which is one of the largest components of the Spending Review in a few weeks’ time.

Chart showing UK public sector employment between June 2001 and June 2021.

See text below for description of trends.

One of the key drivers for any budget or business plan is the number of full-time equivalent employees (FTEs) and it is no different in the public sector, where staff costs in the order of £150bn constitute just under 40% of departmental resource budgets of £385bn in 2021-22 (excluding depreciation and COVID-related spending).

The chart illustrates how public sector employment has grown, fallen and grown again over the last 20 years. It starts with the largest employer in the country – the NHS – where the workforce has increased from 1,025,000 FTEs in June 2001 to 1,626,000 FTEs in 2021. This 59% increase in staffing is substantially greater than the 14% increase in the size of the UK population from 59m to 67m over the same period, reflecting how the combination of more people living longer but less healthy lives and more successful treatments for cancer (for example) have resulted in substantially more for the NHS and its workforce to do.

Education FTEs are up 16% from 997,000 twenty years ago to 1,113,000 this year, is more in line with the growth in the size of the population, although most of the increase happened before the financial crisis, with FTEs working in education still below the peak of 1,210,000 in March 2012.

Public administration is down from 20 years ago, with 966,000 FTEs in June 2021 compared with 998,000 two decades previously. FTEs increased to a peak of 1,081,000 in June 2005 before falling gradually to 1,010,000 in June 2010, followed by more significant falls following the financial crisis. Most of the net fall represents fewer public servants in local government since the financial crisis , with civil servants in central government only slightly below where they were 20 years ago at 465,000 FTEs in June 2021 compared with 492,000 in June 2001. The total would have been much lower but for a post-Brexit surge in the size of the civil service, which has grown by 20% from its nadir of 384,000 FTEs in June 2016.

Police and armed forces FTEs have fallen from 436,000 in June 2001 to 417,000 in June 2021, mainly due to a steady decline in the armed forces from 219,000 to 159,000 FTEs over that period. Police numbers (including civilian support staff) increased from 222,000 FTEs 20 years ago to a peak of 284,000 in September 2009, fell to 235,000 FTEs in December 2016, and then started to increase again over the course of the last two years to reach 258,000.

Other public sector workers, including community health and social workers and employees of public corporations such as the BBC, Channel 4, Crossrail and Ordnance Survey have fallen from 973,000 to 655,000 FTEs, having reached a peak of 1,322,000 in March 2008 following the nationalisation of a number of banks. Most of the fall since then is a consequence of transfers to the public sector, including housing associations, Royal Mail, Direct Line, Lloyds Banking Group and Northern Rock.

Overall, public sector employment grew from 4,429,000 FTEs in June 2001 to a peak of 5,292,000 FTEs in December 2009 before falling to 4,777,000 FTEs in June 2021, comprising net changes of +601,000 in the NHS, +116,000 in Education, -32,000 in public administration, -19,000 in the police and armed forces and -318,000 in other public sector employees.

Of course, staff numbers are only part of the equation as the 4,777,000 FTEs currently employed have to be multiplied by an average salary of around £34,000 a year to reach the more than £160bn estimate for total staff costs across the public sector. This is the average of total pay – the median full-time salary is lower than this at somewhere in the region of £26,000.

Pay is one of the key drivers, with a pay freeze for many public sector workers announced last year helping to constrain the growth in the wage bill. With the cost of living on the march upwards, it seems unlikely that the Chancellor will be able to justify as strict a pay freeze this year, although he will still be looking to constrain wage settlements as much as possible. Wage settlements in the private sector are also likely to be higher this year, another worry for the Treasury given the £230bn or so the public sector spends every year on external procurement.

The recent upward trend in public sector employment is a big challenge for the Spending Review, particularly the continual growth in NHS staff as more people live longer lives, in addition to commitments to recruit more police officers and to improve other public services. Higher wage settlements in both the public and private sectors could significantly affect the number of people the government can afford to employ to meet its policy objectives.

ICAEW writes to Chief Secretary on Spending Review priorities

16 November 2020: Alison Ring, ICAEW’s director for public sector, has written to the Chief Secretary to the Treasury ahead of the Spending Review to stress the importance of investment in infrastructure, data and financial management.

The government has announced that the Spending Review will take place on 25 November 2020 but with the uncertainties caused by coronavirus, it has decided to restrict this to only one year instead of the previously planned three-year time horizon.

In the letter to Steve Barclay MP, Chief Secretary to the Treasury, ICAEW stresses how vital it is the government moves forward with its ambitious programme of infrastructure investment, and that projects are not delayed by the postponement of the Budget until next year and the reduction of the scope of the Spending Review to one year.

Commenting on the letter Alison Ring OBE FCA, ICAEW’s director for public sector said: “The 2020 Spending Review comes at a critical time for the UK and its public finances and will quite rightly focus on the government’s current spending plans for the coming financial year starting in April 2021 and capital budgets for the following year. Well-targeted support will be critical to ensure as strong a recovery from the coronavirus pandemic as possible. 

Our letter to the Chief Secretary focuses on the importance of budgetary certainty to ensure infrastructure projects are green-lit now rather than risking further delays because of the restriction in Spending Review time horizon. The long-delayed National Infrastructure Strategy is urgently needed if the government’s ambitions to level up economic prosperity and deliver carbon neutrality are to be achievable.

The government also has ambitious plans to improve the way government works, with the recently published National Data Strategy setting out how digital innovation will be key. We comment in the letter how the importance of high-quality financial skills, finance processes and risk management to delivering better outcomes and ensuring value for money for taxpayers should not be underestimated. The government does not have the best of records in undertaking major transformation programmes, and we caution the Chief Secretary against under-resourcing the planning stages of these projects. 

Finally, we hope that the government will use the delays in the Budget and the later years of the Spending Review to think about the longer term and how to put the public finances on a sustainable path. Even before the pandemic and the huge amounts of additional borrowing being undertaken this year, the Office for Budget Responsibility had reported that the strains on public services, more people living longer, and growing debts and other public liabilities were not being addressed. A comprehensive long-term fiscal strategy is needed to look beyond the immediate and establish a sustainable framework for the public finances for the next quarter of a century.”

The letter to the Chief Secretary to the Treasury focuses on three key areas, all of which ICAEW believes are essential to re-balancing economic opportunity and performance across the UK and to achieving carbon neutrality, as well as being key to driving the post-pandemic economic recovery in 2021 and the decade ahead.

Sustainable infrastructure investment

The shortening of the Spending Review period risks causing uncertainty in departmental capital budgets and the potential for further delays in getting infrastructure projects underway. ICAEW believes that establishing capital budgets for 2023-24, as well as 2022-23, would help departments to be confident in carrying out the groundwork for these projects so that they can be implemented as soon as possible.

The National Infrastructure Strategy is more urgent than ever to reduce regional inequalities and deliver on the ‘levelling up’ agenda.

Data and financial management

ICAEW welcomes the publication of the recent National Data Strategy and the commitment to rethinking how government works set out in the Chief Secretary’s speech of 28 July – digital innovation and better use of data will be key to delivering improved public services at a lower cost. However, sufficient resources must be provided to the initial stages of these projects – the experience of ICAEW members is that underinvestment in planning is one of the major causes of project failure.

Relatively small amounts invested in improving the quality of financial information needed to support effective decision-making, in more efficient and effective finance systems and processes, and in enhancing financial controls such as fraud prevention and detection are likely to be paid back many times over.

A long-term fiscal strategy

One benefit of the delay in the Budget and the deferral of the second two years of the Spending Review is the additional time this will give the government time to think about the longer term and how to put the public finances on a sustainable path. 

This is more pressing than ever as strains on public services increase, people live longer, and debt and other public sector liabilities continue to grow. 

A comprehensive strategy setting out a framework for taxes, welfare and public services over the next quarter of a century would provide an opportunity for sustainable reform to deliver a robust public balance sheet, a more resilient government machine, and a stronger and more prosperous economy. 

This article was originally published on the ICAEW website.

ICAEW chart of the week: public sector employment

25 September 2020: The #icaewchartoftheweek is on headcount in the public sector, which increased by 115,000 to 5,508,000 in the year to June 2020.

Chart showing change in headcount from June 2019 to 2020: NHS +88k, other health & social work -7k, education -9k, police +12k, forces +4k, civil service +11k, public admin +8k, other +8k = +115k.

Employment on a full-time equivalent (FTE) basis also increased over the last year, with an increase of 118,000 from 4,485,000 FTEs in June 2019 to 4,603,000 FTEs in June 2020.

The NHS workforce jumped by 55,000 in the first six months of 2020 and by 88,000 in the year to June as the coronavirus pandemic accelerated recruitment of health workers. The NHS is the one part of the public sector that has seen consistent headcount growth over the last decade, with 1,782,000 employees at June 2020 compared with 1,558,000 a decade ago. This has been partly offset by a fall in other health and social workers of 7,000 to 208,000 in the year to June, which is 191,000 lower than the 399,000 employed in June 2010.

Public employees working in education also fell by 9,000 to 1,487,000 in June 2020, bringing the total fall over the last decade to 198,000, driven by a combination of cuts in education funding and the reclassification of further education colleges to outside the public sector.

Police numbers (including civilian staff) have started to increase again, with a headcount of 261,000 in June 2020, up 12,000 over a year previously. However, this is still significantly below the 292,000 that were employed in June 2010. HM Forces numbers also started to increase again after a long period of decline, with the approximately 4,000 service personally added to reach 156,000 still substantially less than the 197,000 serving in June 2010.

Civil Service numbers increased by 11,000 over the year to 459,000, with Brexit being a major contributor to the increase from the low-point of 416,000 employed in June 2016, by still significantly below the 517,000 civil servants working in June 2010. Other public administration headcount increased by 8,000 to 614,000 in June 2020, down from 682,000 a decade previously.

The number of other public sector workers increased by 8,000 in the year to 541,000. This is substantially below the 1,105,000 employed in other categories in June 2010, principally because ten years ago the public sector included housing associations, Royal Mail, Direct Line, Lloyds Banking Group and Northern Rock all of which have since been reclassified to the private sector. (Royal Bank of Scotland and Bradford & Bingley remain in the public sector).

Adjusted for reclassifications, total public sector headcount is 215,000 lower than it was a decade ago, reflecting an increase of 224,000 in NHS employees and a net decline of 439,000 across the rest of the public sector.

With Brexit preparations accelerating and the NHS under severe pressure as we approach winter, it is likely public sector employment will continue to rise in the near future.

This chart was originally published on the ICAEW website.