ICAEW chart of the week: What do we all do?

My chart for ICAEW this week looks at what we all do for a living and how the government wants to move more of us from economically inactive categories into the workforce.

Pie chart breaking down UK population between 29.0m employees (42%), 4.3m self-employed (6%), 1.5m unemployed (2%), 3.0m ill or disabled (4%), 2.7m homemakers and other (4%), 12.3m retired (18%), 13.9m children under 16 (20%), 2.5m students 16 and over (4%).

My chart of the week for ICAEW looks at what we do for a living, according to the latest labour market statistics from the Office for National Statistics (ONS) for the third quarter between July and September, when the estimated population was 69.2m. 

According to the ONS, 29m people (42% of the total population) were in employment, 4.3m (6%) were self-employed and 1.5m (2%) were unemployed seeking work. In total this is fractionally just over half of the population (50.3%).

The other (almost) half of the population were not in work. They comprised 3m (4%) not working because of illness or disability, 2.7m (4%) homemakers or not working for other reasons, 12.3m (18%) people in retirement, 13.9m (20%) children under the age of 16, and 2.5m (4%) students aged 16 or over who were not also working.

The 33.3m who were employed or self-employed include 1.5m people aged 65 or more and 1.1m students in full-time education who also work. Around 5.9m work in the public sector. Overall, there are 24.9m people working full-time and 8.4m working part-time, while some 1.2m workers have more than one job. 

The 1.5m unemployed include 0.2m students in full-time education who are actively seeking work. Meanwhile, the 12.3m in retirement include 1.1m people who are under the age of 65.

The ONS also reports that 1.9m of those who are economically inactive between the ages of 16 and 64 would like a job, including 0.7m of those who are not working because of illness or disability. 

The government is very keen to get as many as possible of the 1.5m people who are unemployed, and the 3.0m not working because of illness or disability, into work. This would benefit the public finances twice over by not only reducing the cost to the exchequer of welfare payments paid out, but also by increasing the amount of tax receipts coming in.

Recent statements from government ministers have suggested that their strategy includes tightening the eligibility criteria for illness and disability benefits, in addition to providing additional support to help people back into the workforce.

The government is also looking at how it can encourage some of the 1.1m retirees below the age of 65 back into work, as well as persuading more of us to work beyond the statutory retirement age of 66.

This chart was originally published by ICAEW.

ICAEW chart of the week: Labour market

My chart for ICAEW this week is on the labour market, breaking down the employment status of the 55.1 million adults aged 16 or over in the UK.

Labour market | 
ICAEW chart of the week | 

‘Treemap’ chart featuring rectangles scaled to the numbers. 

55.1m UK adults aged 16 or over. 

Active: 34.5m (left hand side). 

Private sector employees 22.6m. 
Public sector employees 6.0m. 
Self-employed 4.5m. 
Unemployed 1.5m. 

Inactive: 20.6m (right hand side). 

Inactive 65+ 11.2m. 
Sick 3.0m. 
Students 2.5m. 
Homemakers 1.7m. 
Retired 16-64 1.1m. 
Other 1.1m.    


13 June 2024.   Chart by Martin Wheatcroft FCA. Design by Sunday. 

(C) ICAEW 2024.

Our chart illustrates the employment status of the 55.1m adults in the UK on the basis of the latest statistics reported by the Office for National Statistics (ONS), published on 11 June 2024 for the three months from February to April 2024. The ONS is well ahead of the Labour Party’s proposals to extend the franchise in that it has long classified individuals aged 16 or 17 as ‘adults’ for the purposes of its labour market statistics. 

According to the latest numbers, there are 34.5m economically active individuals in the UK, comprising 22.6m private sector employees, 6.0m public sector employees, 4.4m self-employed and 1.5m unemployed.

A further 20.6m adults are not economically active, comprising 11.2m individuals aged 65 or more (most of whom are retired), 3.0m aged 16-64 who are sick, 2.5m students, 1.7m homemakers, 1.1m who have taken early retirement, and 1.1m others who are either not active for other reasons, or where the reason they are not active is not clear. 

The 2.5m student number excludes 1.2m students and pupils with part-time jobs, who are included within the economically active category.

The inactive total includes 1.7m adults aged 16-64 who don’t meet the criteria to be officially classified as unemployed but say that they would like a job, comprising 0.3m or so students, 0.4m homemakers, 0.7m sick and 0.3m other.

The inactive numbers between age 16 and 64 have been broadly stable over the past few years (plus or minus 0.1m) with the exception of the number who are sick. This has increased from 2.3m (2.1m long-term sick and 0.2m temporarily sick) in the same period in 2020 – at the start of the pandemic – to 3.0m (2.8m long-term sick and 0.2m temporarily sick) today. This is a 32% increase in the number of long-term sick, a major issue both for the economy and the NHS.

The 33.0m people in work include 1.5m who are aged 65 or over, but unfortunately the ONS doesn’t provide a breakdown between those in work who are aged 65 (and therefore still shy of the state retirement age) and those who are aged 66 or more who could retire but have chosen or need to continue working. 

Public sector employees comprise 2.0m in the NHS, 1.5m in education, 1.2m in public administration (including 0.5m in the civil service), 0.4m in the police and armed forces, 0.2m in other health and social work, and 0.7m in other areas.

According to the ONS, the employment rate is 74.3%, being the total of those in work between 16 and 64 (33.0m total – 1.5m over 65 = 31.5m) divided by the total number aged between 16 and 64 (31.5m in work + 1.5m unemployed + 9.4m inactive = 42.4m).  

In contrast, the unemployment rate of 4.4% is calculated including those aged 65 or more but excluding those who are inactive, dividing the just over 1.5m who are officially unemployed (of whom 48,000 are 65 or more) by the just under 34.5m total number of economically active individuals

This chart was originally published by ICAEW.

ICAEW chart of the week: Schools out

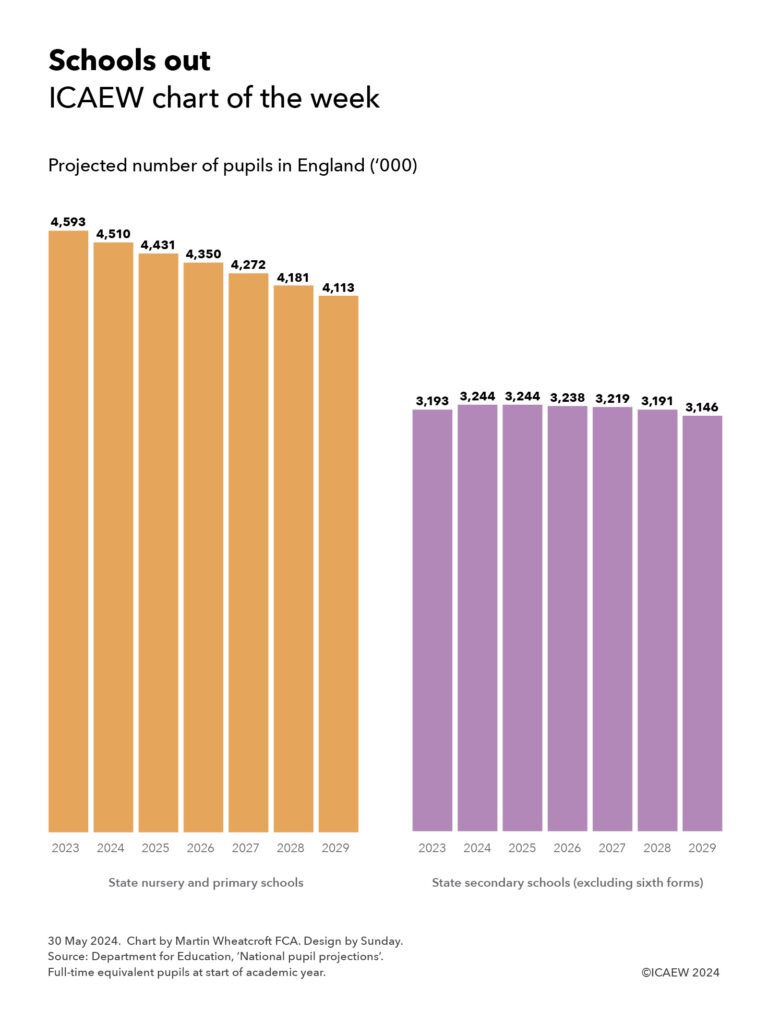
Our chart looks at the projected state school population in England over the next six years, with an anticipated 10% fall in state nursery and primary school pupils implying school closures and mergers are on the way.

Schools out | 
ICAEW chart of the week | 

Dual column charts showing the projected number of pupils in England in thousands ('000) | 

Left hand chart: State nursery and primary schools | 
2023 - 4,593 | 2024 - 4,510 | 2025 - 4,431 | 2026 - 4,350 | 2027 - 4,272 | 2028 - 4,181 | 2029 - 4,113 | 

Right hand chart: State secondary schools (excluding sixth forms) | 

2023 - 3,193 | 2024 - 3,244 | 2025 - 3,244 | 2026 - 3,238 | 2027 - 3,219 | 2028 - 3,191 2029 - 3,145 | 


30 May 2024. Chart by Martin Wheatcroft FCA. Design by Sunday. 

Source: Department for Education, 'National pupil projections'. 
Full-time equivalent pupils at start of academic year. 

© ICAEW 2024

According to Department for Education statistics, there were an estimated 8,425,000 school pupils under the age of 16 in England at the start of the current academic year in 2023. Of these, 4,593,000 were in maintained nursery and state primary schools, 3,193,000 were in state secondary schools, 131,000 were in state special schools, 13,000 were in alternative provision, and 496,000 were in independent and other non-maintained schools. 

Our chart this week shows how the first two categories are projected to change over the next six years, starting with a projected 10% fall in pupil numbers in state nursery and primary schools from 4,593,000 in the current academic year to 4,113,000 in the academic year starting in 2029.

Meanwhile the number of state secondary school pupils under the age of 16 at the start of the academic year is expected to increase from 3,193,000 in this academic year to peak at 3,244,000 next year before gradually declining to 3,146,000 in 2029, a fall of 3% from the peak.

Driven by a falling birthrate, the 10% projected fall in state nursery and primary school pupils is likely to be a major issue across England and a political hot potato for the next government. Larger primary schools may be able to cut the number of classes (ironically increasing class sizes) to mitigate reduced income from falling rolls, but this may not be enough. Smaller schools with just one class per year will find it more difficult to find savings. 

Closures and mergers are likely, as are a rise in ‘save our local school’ campaigns as academy trusts and local authorities seek to find savings in response.

The 3% decline from the peak in secondary school pupil numbers will also present major challenges, especially as the fall in numbers is unlikely to be spread evenly across all state secondaries. Some will see smaller falls or even rises in their school rolls, while others will see a much greater drop in their intakes. Again, reducing the number of classes in each year is a likely response for those affected, but some closures and mergers are almost inevitable.

These projections are subject to some uncertainty, despite the core numbers being based on children who have already been born that are likely to stay in the English education system for the entirety of their school careers. The level of migration is a key assumption and could lead to even lower pupil numbers if recently implemented restrictions on the eligibility of immigrants to bring dependents with them are effective. The projections also assume a relatively stable number of pupils going to private schools, which may need to be adjusted in the light of Labour’s proposals to add 20% VAT to school fees.

These statistics are prepared on a full-time equivalent basis, but these are deemed to be the same as total pupil numbers for each age group, apart from the under 5s. Many nursery pupils and primary school reception class students only attend on a part-time basis, with 974,000 under 5s converting into 874,000 full-time equivalents (FTEs) in the current academic year. These numbers exclude most under 5s who attend private nurseries, receive other forms of childcare, or stay at home.

In theory, falling school rolls should reduce pressures on the education budget while at the same potentially increasing per-pupil funding, depending on how much is cut from the school budget. However, with the Spending Review now scheduled for after the general election likely to result in upward revisions to the Spring Budget 2024 medium-term spending plans, any such savings are likely to be swallowed up.