ICAEW chart of the week: Retail sales in Great Britain

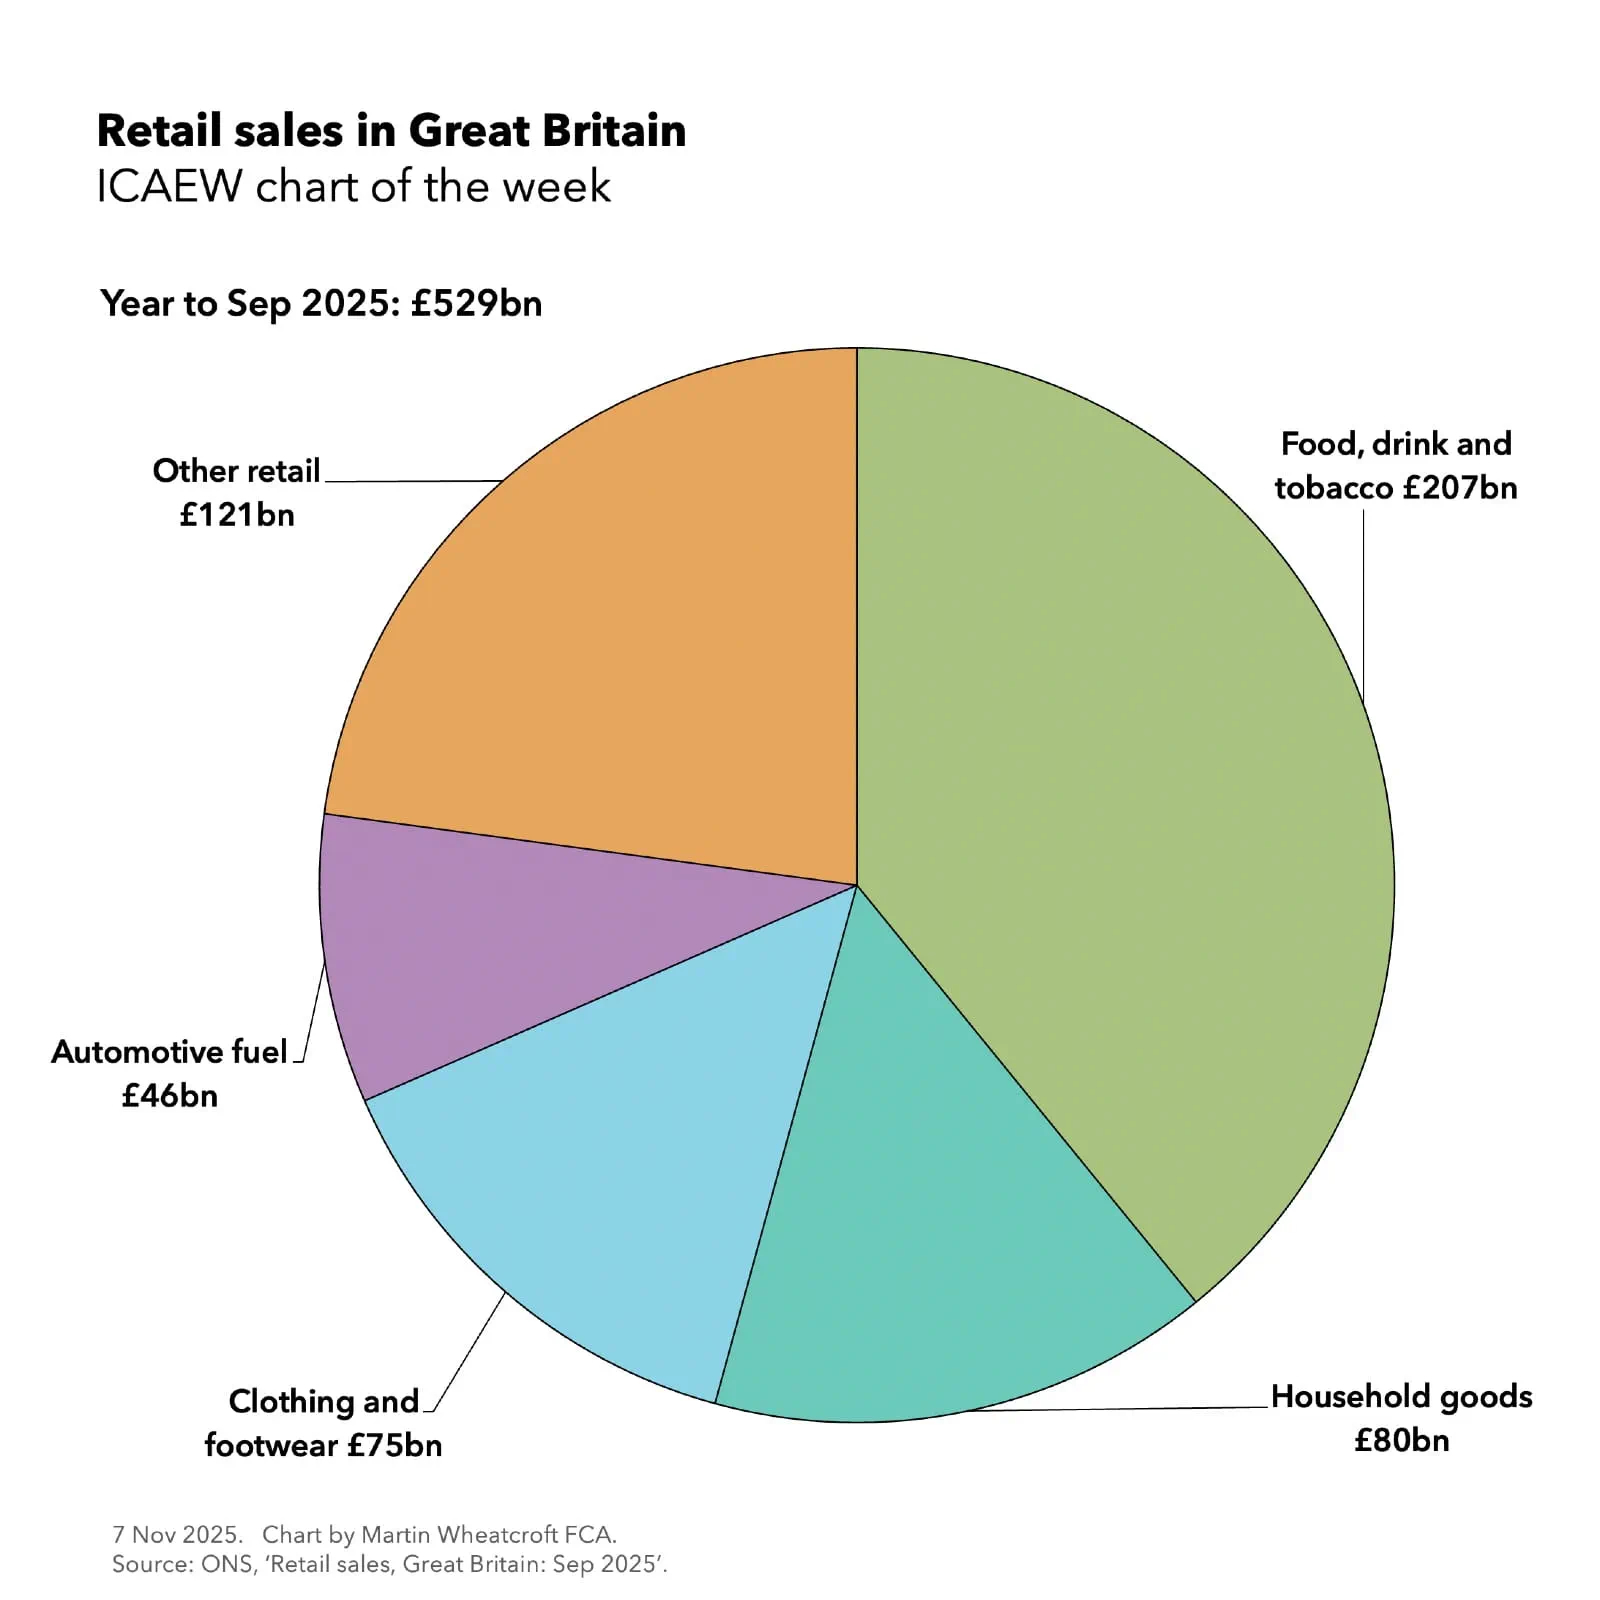
My chart for ICAEW this week breaks down the £529bn of sales made by retailers in England, Wales and Scotland in the year to September 2025.

ICAEW chart of the week: Retail sales in Great Britain. 

Pie chart showing the breakdown of retail sales in the year to Sep 2025 of £529bn. 

Food, drink and tobacco £207bn. 
Household goods £80bn. 
Clothing and footwear £75bn. 
Automotive fuel £46bn. 
Other retail £121bn. 

7 Nov 2025. Chart by Martin Wheatcroft FCA. 
Source: ONS, 'Retail sales, Great Britain: Sep 2025'.

Retail sales are a core component of the economy, and my chart for ICAEW this week takes a look at the total amount of sales made by retailers over the past year. 

According to the Office for National Statistics (ONS), total sales of £529bn in Great Britain between October 2025 and September 2026 comprised £207bn (39%) of food, drinks and tobacco, £80bn (15%) of household goods, £75bn (14%) of clothing and footwear, £46bn (9%) in automotive fuel, and £121bn (23%) in other retail categories.

This £529bn in sales is equivalent to around £10bn a week on average and represents around 18% of overall economic activity in England, Wales and Scotland by value.

The ONS also analyses the data by type of store, with £410bn and £119bn generated in sales by large (100 employees or more) and small (99 employees or fewer) retail businesses respectively, while around £132bn or 25% of retail sales are now transacted online.

Supermarkets and other ‘predominately’ food stores made sales of £209bn last year (of which £20bn or 10% was online), while textile, clothing and footwear stores recorded £57bn (£16bn or 28% online), household goods stores recorded £37bn (£9bn or 24% online), department and other non-specialised stores recorded £39bn (£10bn or 26% online) and all other stores generated £70bn (£15bn or 21% online). Internet, mail order, and other ‘non-store’ retailers (such as market stalls) made £70bn (£62bn online). None of the £46bn in petrol and diesel sales were reported as being online.

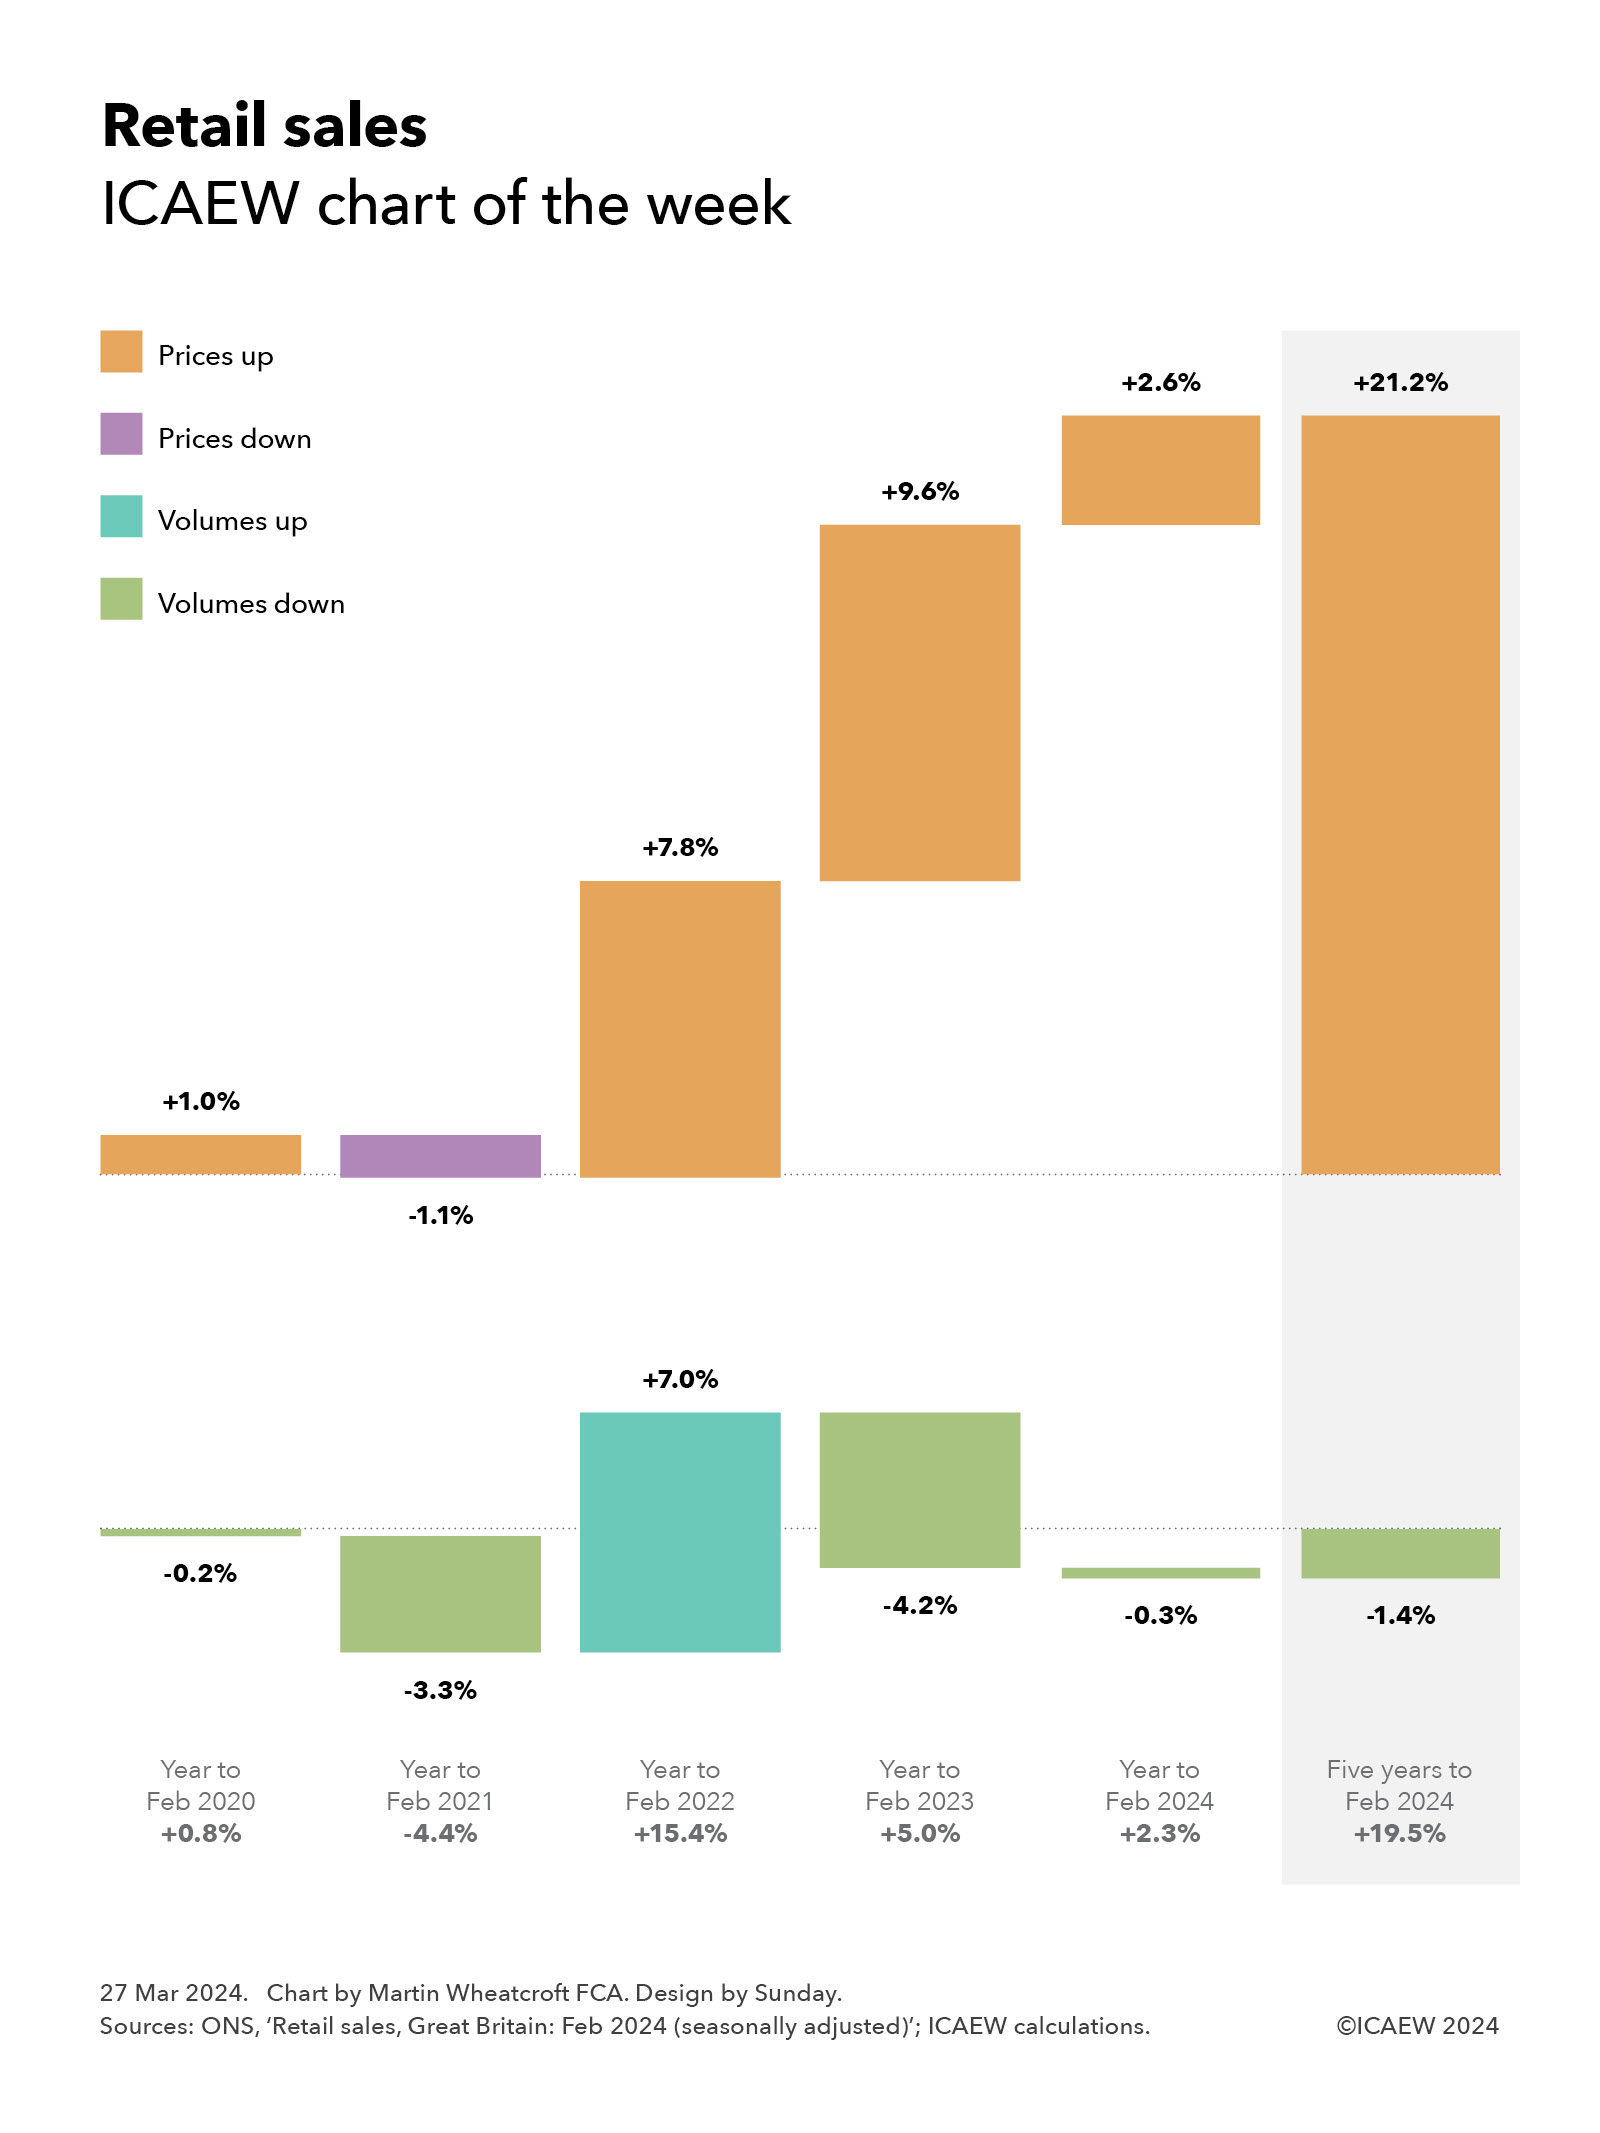
According to the ONS, seasonally adjusted retail sales volumes in September 2025 are at their highest level since 2022 but 1.6% lower than in February 2020 prior to the pandemic.

This decline in the amount of ‘stuff’ being bought by British consumers despite a growing population is primarily a reflection of the squeeze on household budgets from the cost-of-living crisis combined with relatively weak growth in household incomes over the last few years.

The concern for many retailers in the next few weeks will therefore be not only what business tax measures might be announced in the Autumn Budget 2025, but also the effect that other tax measures might have on household disposable incomes and, hence, the ability and willingness of consumers to spend their money in the shops and online.

This chart was originally published by ICAEW.

ICAEW chart of the week: Retail sales

My chart for ICAEW this week looks at how retail sales have increased by 19.5% over the past five years, comprising a 1.4% fall in volumes and a 21.2% increase in prices.

Double step chart:

Years to Feb 2020, 2021, 2022, 2023 and 2024 = Five years to Feb 2024.


Retail sales
ICAEW chart of the week

Prices up (orange)
Prices down (purple)
Volumes up (teal)
Volumes down (green)

Top step chart: prices

+1.0%, -1.1%, +7.8%, +9.6%, +2.6% = +21.2%

Bottom step chart: volumes

-0.2%, -3.3%, +7.0%, -4.2%, -0.3% = -1.4%

Total retail sales in the horizontal axes descriptions:

Year to Feb 2020 +0.8%, Year to Feb 2021 -4.4%, Year to Feb 2022 +15.4%, Year to Feb 2023 +5.0%, Year to Feb 2024 +2.3% = Five years to Feb 2024 +19.5%


27 Mar 2024.
Chart by Martin Wheatcroft FCA. Design by Sunday.
Sources: ONS, 'Retail sales, Great Britain: Feb 2024 (seasonally adjusted)'; ICAEW calculations.

(c) ICAEW 2024

The latest statistics from the Office for National Statistics (ONS) up to February 2024 highlight how retail sales in Great Britain (England, Wales and Scotland) have been on a rollercoaster ride over the past five years as the pandemic, then the cost-of-living crisis, battered the economy.

As our chart of the week illustrates, changes in retail sales can be split between volumes and prices, with growth in retail sales of 19.5% over the five years to February 2024 consisting of a 1.4% fall in volumes and a 21.2% increase in prices.

Our chart also shows how retail sales have increased by year, starting with a 0.8% increase in retail sales in the year to February 2020 (from a 0.2% fall in volumes and a 1% increase in prices) before the first pandemic lockdown the following month. That first year of the pandemic to February 2021 resulted in a 4.4% decline in sales (a 3.3% fall in volumes and a 1.1% reduction in prices) as we cut back on spending, followed by a massive 15.4% jump in retail sales in the year to February 2022 (7% from higher volumes and 7.8% from higher prices) as the nation emerged and started to spend heavily.

The cost-of-living crisis was behind a 5% increase in retail sales in the year to February 2023, as although prices rose 9.6% as inflation accelerated, households cut back on what they bought in response to drive a 4.2% fall in retail volumes.

Retail sales were up by a more modest 2.3% in the year to February 2024, comprising a 0.3% fall in volumes and a 2.6% increase in prices as inflation moderated.

Evening out the ups and downs gives an average increase in retail sales of 3.6% a year over the last five years, comprising an average fall of 0.3% a year in volumes and an average increase of 3.9% in prices.

This is not as positive a picture for retail business as the numbers might imply. Although it appears that retailers are selling slightly less overall at much higher prices, our chart doesn’t reflect the substantial increases many have seen in their input costs over the same period.

For more ICAEW analysis on the economy, click here.

This chart was originally published by ICAEW.

ICAEW chart of the week: Christmas 2022

Our final chart of 2022 shows how spending on Christmas is expected to fall significantly this year as the cost-of-living crisis takes its toll on family finances.

Step chart showing change in average spending per person on Christmas over the last three years (skipping Christmas 2020).

Christmas 2019: £412

Inflation: +£23
Change: -£9

Christmas 2021: £426

Inflation: +£46
Change: -£79

Christmas 2022: £393

PwC’s annual pre-Christmas survey indicates that spending on Christmas was expected to be below pre-pandemic levels, with average spending of £412 in December 2019 (before the pandemic) increasing to £426 in December 2021, before falling to £393 this Christmas. 

The chart takes inflation into account to provide an illustration of what has happened to average spending in real terms. Excluding December 2020, when Christmas was cancelled for many of us, average spending would have been £23 higher if it had kept pace with inflation of 5.5% over the two years between 2019 and 2021, implying spending was expected to be £9 lower last Christmas than it had been before the pandemic.

The effect is even more marked this year, when keeping pace with consumer price inflation of 10.7% would lead to an extra £23 being spent compared with last Christmas. In this year’s survey, respondents expected to spend much less than in previous years, with an implied reduction of £79 or 17% after taking account of inflation.

We have used the overall CPI index as of November of each year presented in the chart, but in practice inflation runs at different rates for each element of spending. Food and non-alcoholic beverage inflation is currently running at over 16% meaning Christmas dinner is likely to cost even more this year, which for many is likely to offset any real terms ‘savings’ on alcohol where inflation is running at just over 4%.

According to PwC, 50% of spending on Christmas presents was expected to be completed around or before Black Friday in November, while 44% was planned for early to mid-December and 6% to be bought in the last week before Christmas or later. PwC also reports that the majority of Christmas present buying is now done online, with 55% ordered for delivery, 10% through click and collect, and just over a third to be purchased in-store.

Irrespective of how inflation is calculated, what is clear is that there is a substantial reduction in spending on Christmas festivities in 2022. This highlights how household finances are under significant pressure as we come to the end of the third year of the pandemic.

The ICAEW chart of the week is taking a break over the Christmas period and will return in 2023 with new charts on diverse subjects.

This chart was originally published by ICAEW.

ICAEW chart of the week: UK card activity

9 April 2020: Debit and credit cards were used 19.7bn times in 2019, with £722bn spent.

Debit and credit card activity in the UK 2019: 19.7bn transactions for £722bn.  Debit cards 15.6bn for £503bn, credit cards 4.1bn for £219bn.

This #icaewchartoftheweek is on the subject of credit and debit usage in the UK, with UK Finance (the trade body for the banking and financial sector) reporting that £722bn was spent on UK and overseas cards in 2019. This comprised 19.7bn transactions at an average of just under £37 per transaction.

Average spending on credit cards at £53 per transaction was higher than the average of £32 spent on each debit card transaction. As a consequence, credit cards were around 30% of the total spend, but 21% of total transactions.

The number and value of contactless transactions both increased by 16% compared with 2018, as more and more people chose to use this form of payment. The average contactless spend was £9.35 on 8.6bn occasions, in contrast with the £81 spent on each of the 2.7bn online transactions in 2019, and the average of £50 incurred in 8.4bn non-contactless transactions.
 
Overall spending on credit and debit cards in 2019 was only 0.2% higher than in 2018, even though the number of transactions was up by 7.3%. This provides an indication of the weakness in the UK economy before recent events.
 
Of course, what we all want to know if what is happening right now. With the country in lockdown, the number and value of transactions are likely to fall significantly. We will be poring over that data as soon as it is made available!

ICAEW chart of the week: retail sales

3 April 2020: the #icaewchartoftheweek is on the subject of retail sales, with UK supermarkets experiencing a 20.5% growth in sales in the four weeks ending on Saturday 21 March 2020 according to Nielsen.

Supermarket sales: £9.2bn 4 weeks to 23 Mar 2019 + £1.2bn 3 more shopping trips +£0.7bn 1 more item per basked = £11.2bn 4 weeks to 21 Mar 2020.

This is dramatic for the sector, with sales in the last week in that period up 43% over the equivalent week last year.

Although newspaper headlines are full of stories about panic buying, the statistics themselves provide a more nuanced perspective. Shoppers each made an additional three visits to supermarkets over the four-week period at the same time as adding an extra item to each basket (up from 10 to 11 items on average), with the average spend per basket increasing from £15 to £16.

Although some of those extra £1s will have gone on stocking up on toilet rolls and pasta, in practice the majority of this additional spending will have simply replaced food and drink previously bought elsewhere, as pubs, restaurants, works canteens and school lunches have all ceased to operate over the course of the last few weeks.

A boom time for supermarkets, but terrible for most of the rest of the retail sector.

This chart was originally published by ICAEW.

ICAEW chart of the week: Q4 retail sales

Chart: 2018 Q4 retail sales £121.3bn + inflation (1.4%) £1.7bn + sales growth (0.9%) £1.1bn = £124.1bn 2019 Q4 retail sales.

Concerned about the state of the UK economy? Then the latest retail sales numbers will not have helped, with fourth quarter sales in the UK mainland just 0.9% higher after inflation over a year earlier, as illustrated by the #icaewchartoftheweek.

With population growth still estimated to be running at around 0.6% a year, this implies that retail sales per capita in Q4 (at around £635 per month) were just 0.3% higher after inflation than the same period in 2018.

Sales in Q4 of £124.1bn comprised £41.3bn on food, drink and tobacco, £21.3bn on clothing and footwear, £19.6bn on household goods, £11.5bn on automotive fuel and £30.4bn on other non-food purchases. On a per capita basis, this is equivalent to approximately £210 per person per month on food, drink and tobacco, £110 on clothing and footwear, £100 on household goods, £60 on automotive fuel and £155 on other non-food purchases.

This low level of growth on a year earlier reflects a slow-down in retail activity in the fourth quarter of 2019, with the Office for National Statistics reporting that Q4 sales were 0.9% lower than the third quarter on a seasonally-adjusted basis.

This will feed into fourth quarter GDP, which will not be good news for the Chancellor as he puts together what is being rumoured to be a radical first Budget in March – a weak economy will reduce his room for manoeuvre to reform the tax system while boosting public spending at the same time.