The recent passing of the Renters’ Rights Act 2025 prompts my chart of the week for ICAEW to take a look at just how many households there are in England.
The Renters’ Rights Act 2025 was given royal assent on 27 October, providing a range of new protections for tenants of private sector landlords in England. Its passing prompted us to ask just how many private sector tenancies will be affected by these changes once they are introduced into law.
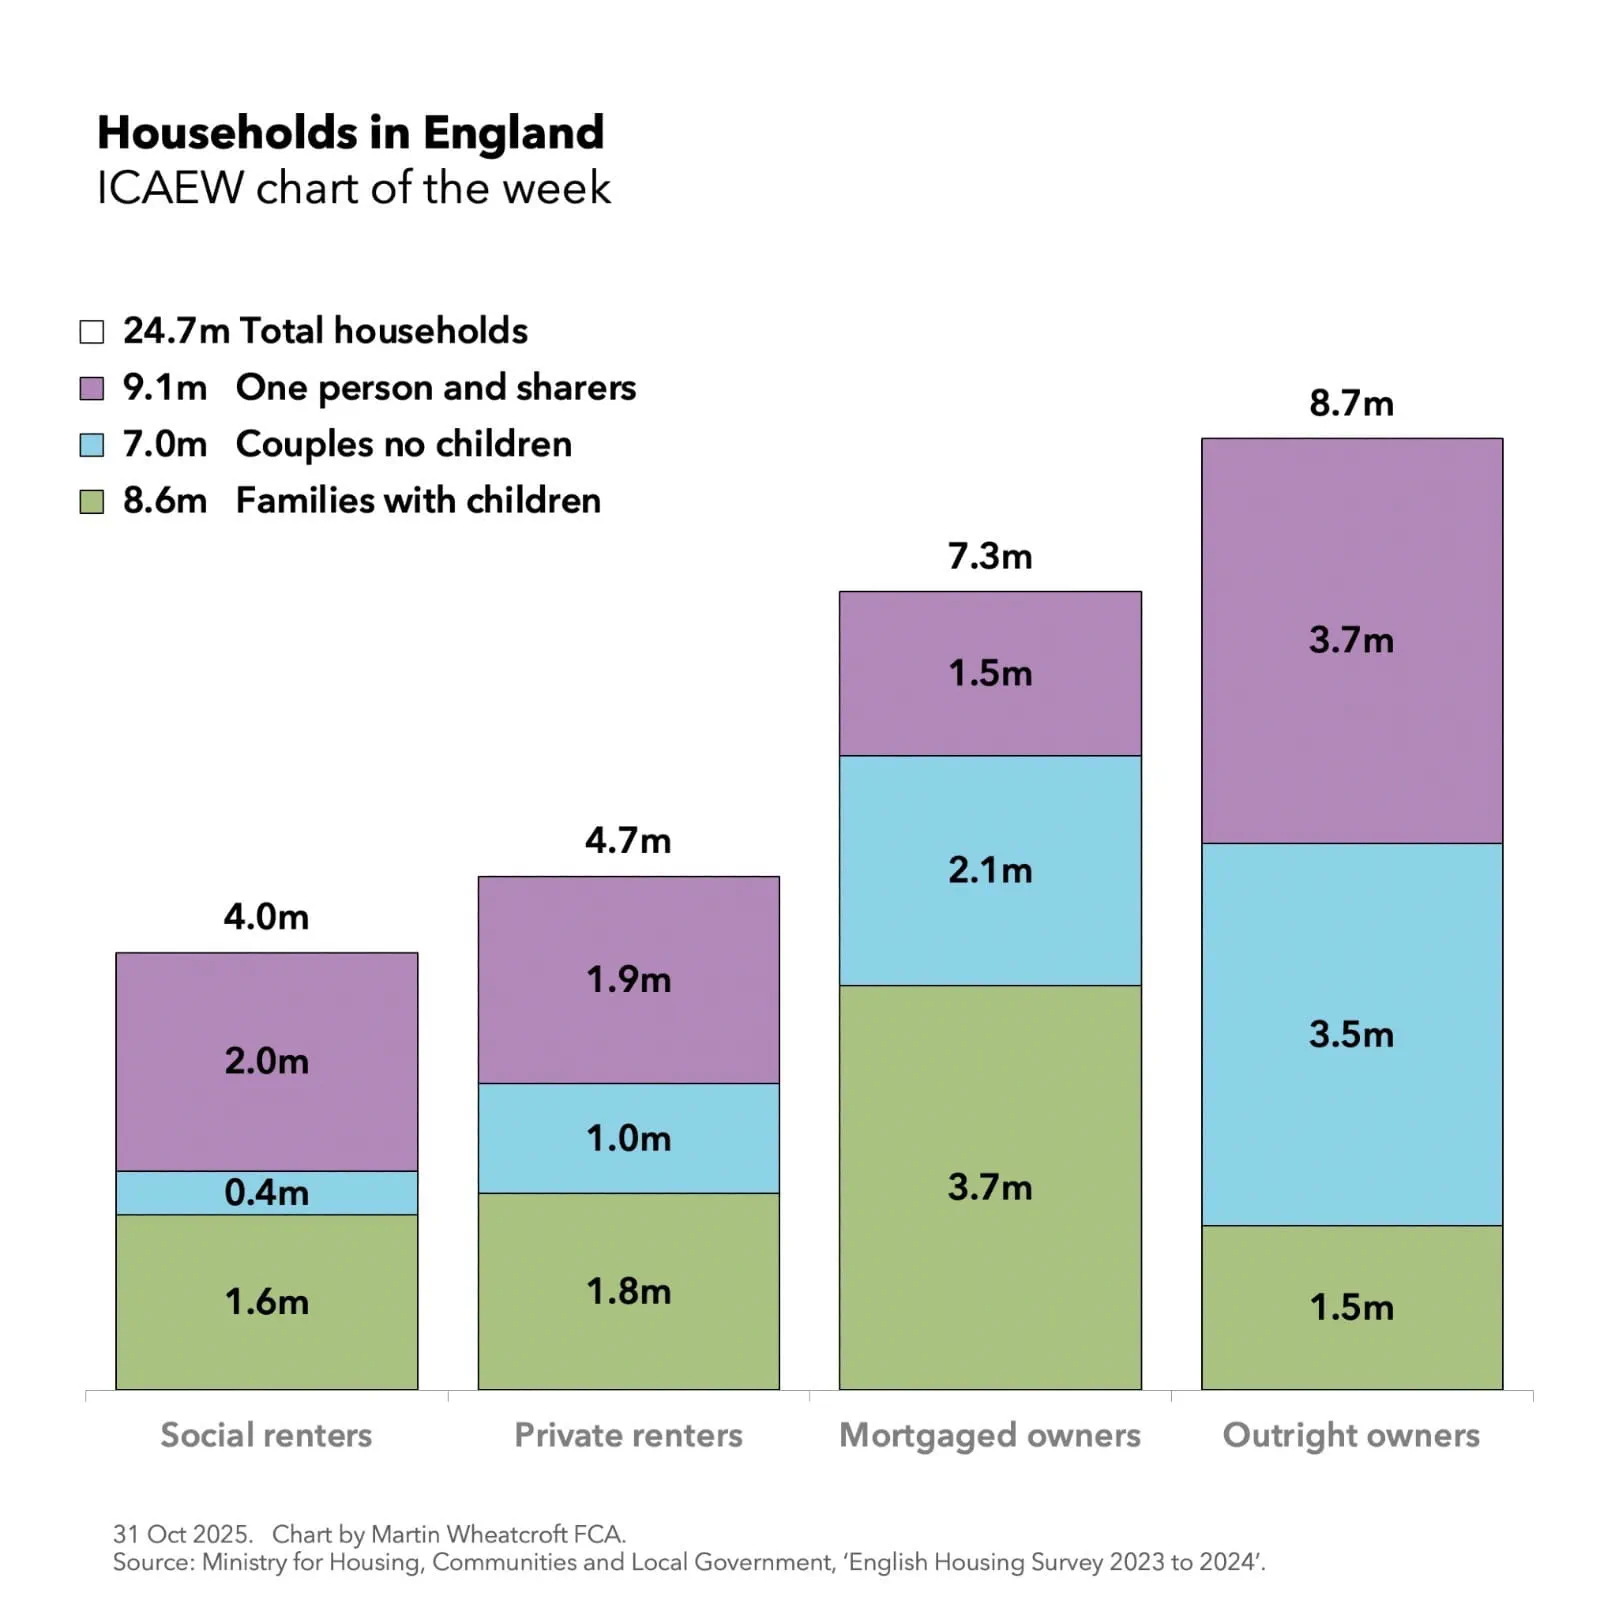
My chart for ICAEW this week illustrates that there were 24.7m households in England in 2023/24 according to the Ministry of Housing, Communities and Local Government. Of these, 4.0m, or 16% of households, were in social housing (2.5m housing association and 1.5m local authority properties), 4.7m, or 19%, were tenants of private sector landlords, 7.3m, or 30%, were in properties owned with a mortgage, and 8.7m or 35% were in properties owned outright.
The chart also shows a breakdown of the 8.6m families with children (1.6m social renters, 1.8m private renters, 3.7m mortgaged owners and 1.5m outright owners), 7.0m couples with no children (0.4m, 1.0m, 2.1m and 3.5m respectively), and 9.1m one person or shared households (2.0m, 1.9m, 1.5m and 3.7m respectively).
The 8.6m family households comprised 5.7m couples with children, 2.5m lone parents with children, and 0.4m two or more family households, while the 9.1m one person or shared households comprised 8.5m one person households (4.5m female and 4.0m male) and 0.6m shared households containing two or more lone persons.
The 4.0m social renter households, 4.7m private renters, 7.3m mortgaged owners and 8.7m outright owners comprise 8.6m, 10.7m, 19.6m and 16.0m people respectively – the latter reflecting the older demographic where we see more outright ownership, fewer children and a higher proportion living alone.
For both tenants and their landlords, the Renters’ Rights Act 2025 will result in significant changes to their contractual arrangements and legal rights. The measures include new restrictions on no fault evictions, the end of fixed-term tenancies, limitations on rent increases, a new ombudsman, a requirement on landlords to register their properties, more rights to have pets, higher property standards, deadlines for rectifying hazards, an end to discrimination against those on benefits or who have children, an end to post-advertisement bidding wars, strengthened local authority enforcement, and the ability for rent repayment orders to be recovered from superior landlords.
My chart for ICAEW this week looks at the government’s priorities as expressed through departmental budgetary allocations over the next three years.
The Spending Review 2025 establishes base operating budgets for government departments for the three financial years from 1 April 2026 (2026/27, 2027/28 and 2028/29) and base capital budgets for four financial years (extending to 2029/30).
Departmental budgets for the current financial year ending on 31 March 2026 (2025/26), total £648bn and are expected to rise to £678bn in 2026/27, £697bn in 2027/28, and £717bn in 2028/29, an increase of 10.6% over the three years or 3.4% a year. This is equivalent to an average increase of 1.5% a year in real terms after adjusting for inflation of 1.9% a year on average over the spending review period.
The totals can be analysed between operating or ‘day-to-day’ budgets of £517bn, £536bn, £552bn and £568bn in 2025/26, 2026/27, 2027/28 and 2028/29 respectively and capital budgets of £131bn, £143bn, £145bn and £149bn. These are real terms increases of 1.2% and 2.4% a year on average over three years.
The capital budget in 2029/30 is £152bn, a cut in real terms that reduces the average annual increase in capital budgets over four years to 1.8% a year on average.
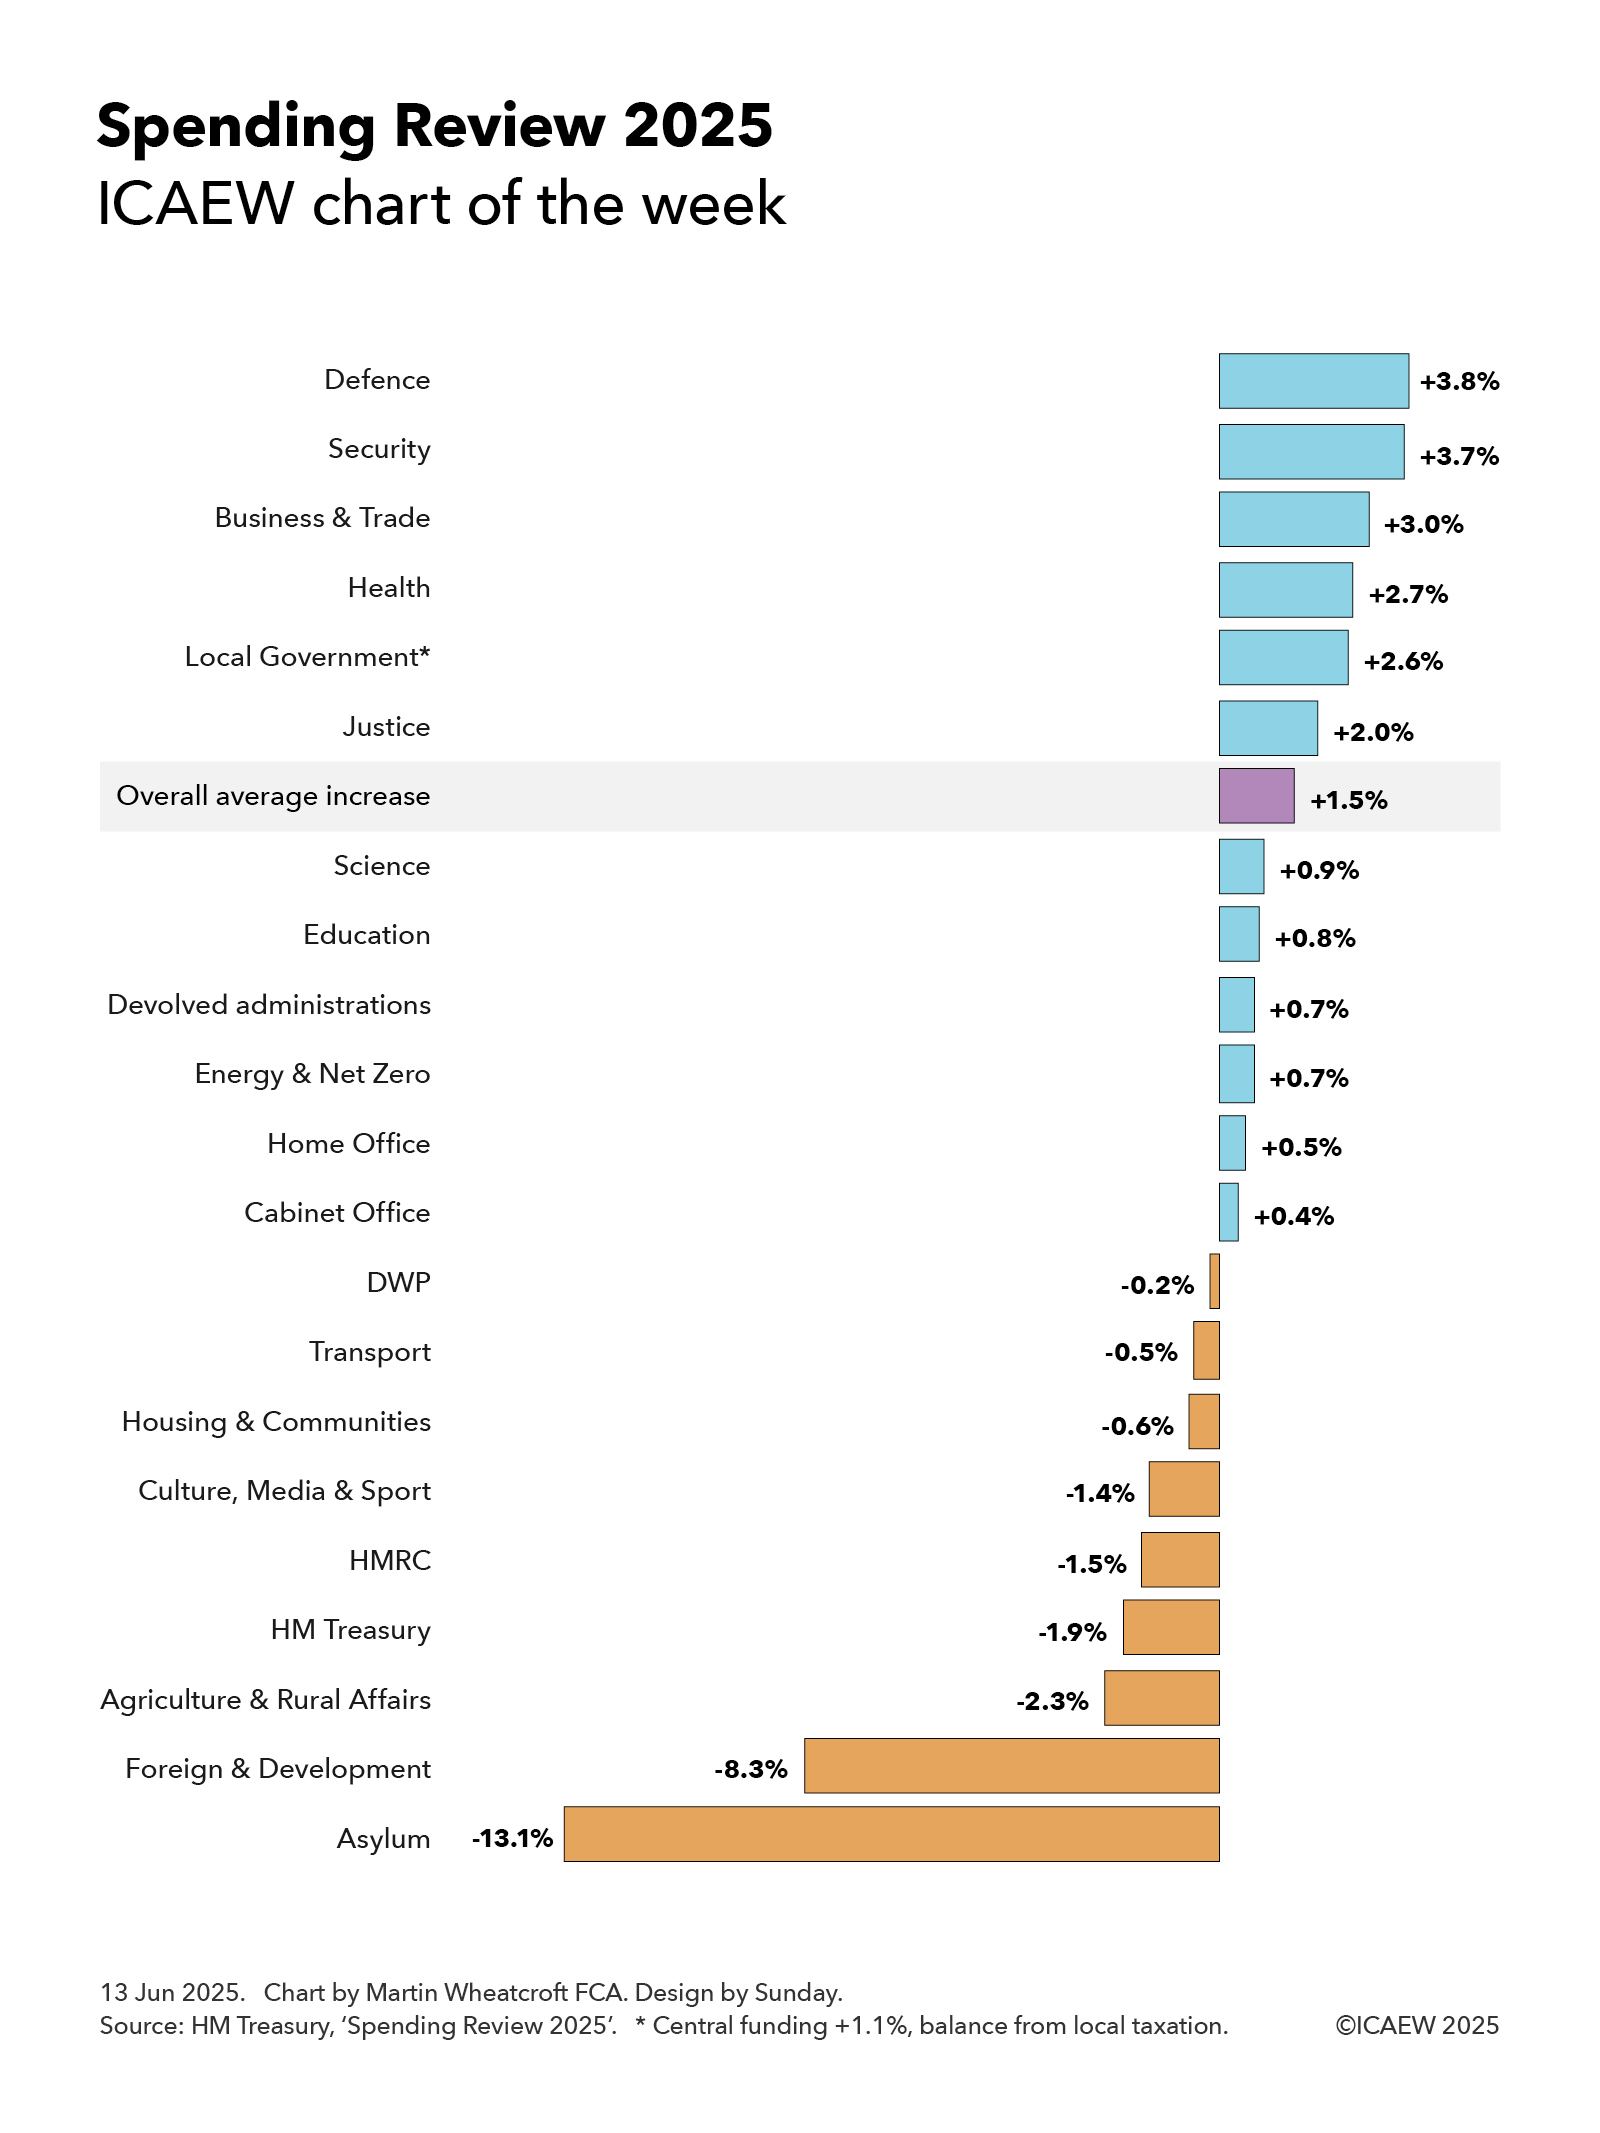
My chart this week highlights how the 1.5% average annual real increase over three years in total budgets (operating and capital) has been allocated across departments, starting with the Ministry of Defence, which leads the pack with an average increase in its budget of 3.8% a year, followed closely by the security services, with an average annual increase of 3.7%. This reflects the elevation of national defence and security to the top of the government’s priorities since the general election last year, even though this increase will only move defence and security spending from 2.3% of GDP currently to 2.6% of GDP by 2027, a long way off the proposed 3.5% of GDP new minimum to be discussed at the NATO summit.
Economic growth and the NHS are the next highest priorities for the government and so it is perhaps unsurprising that the Department of Business & Trade does well with an annual average increase of 3.0%, closely followed by the Department of Health & Social Care, which receives 2.7%. The latter is the biggest increase in cash terms, at £31bn in total or about £12bn more in 2028/29 after adjusting for inflation.
Local government finances are in a parlous state and so the government has pencilled in a 2.6% average annual increase in core budgets for local authorities in England over the next three years. However, it is only increasing central funding by 1.1% a year on average, implying the balance will need to be made by local taxation, principally council tax.
The Ministry of Justice has been awarded 2.0% a year on average as the government seeks to tackle significant backlogs in the courts, overcrowded prisons and significantly under-resourced probation services.
The Department of Science, Innovation and Technology has received a below average annual increase of 0.9% over the next three years, but this follows an almost 12% increase over the past two years as the government has sought to increase investment in research and development to boost economic growth.
Despite being a key priority for the government, the Department for Education has only received a 0.8% average annual increase, partly because of falling primary school rolls in line with a significant fall in the birth rate over the last decade.
The devolved administrations – Scotland (0.8%), Wales (0.7%) and Northern Ireland (0.5%) – are budgeted to receive an average of 0.7% a year over three years as a consequence of the Barnett formula that links UK national government spending in England to the block grants provided to each devolved administration, adjusted for relative changes in population among other factors.
The Department for Energy Security and Net Zero is budgeted to receive 0.7% on average over three years, although this translates into an average annual increase of 2.7% a year once the UK government’s one-off (but long running) investment in the Sizewell C nuclear power plant is excluded. The latter peaks in the spending review period, but then starts to fall.
The Home Office is scheduled to receive a below average increase of 0.5% a year, although the government notes that core police operating budgets should go up by 1.7% once the contribution from local taxation is factored in. This increase also excludes spending on asylum seekers, a big item within the Home Office budget that is expected to fall by a real term average of 13.1% a year over three years as the backlog in asylum claims is tackled and lower cost alternatives to housing claimants in hotels are found.
The Cabinet Office is expected to receive just 0.4% on average reflecting the contribution that planned efficiency savings are expected to contribute to administrative budgets. This is also the reason for the 0.2% a year real-terms fall in the Department for Work and Pensions (DWP) budget as automation helps reduce the cost of administering the welfare system.
The budget of the Department for Transport is expected to fall by 0.5% a year overall, but this partly reflects a fall in spending on High Speed 2 as it comes closer to completion. If that is excluded, the department’s budget is expected to increase by 0.5% a year on average. The actual increase in spending should be even higher, as the budget is net of passenger revenues that are expected to grow at a faster rate over the next three years.
Extra money for housing was found within the spending review, but this wasn’t enough to stop the budget for the Department of Housing, Communities and Local Government from shrinking by an annual average of 0.6% a year as other activities are cut back, while the Department for Culture, Media & Sport (-1.4% a year on average) has also been asked to cut back its activities.
HMRC (-1.5% a year) and HM Treasury (-1.9% a year) see their budgets reduced significantly, with digitisation and efficiency savings expected to contribute significant sums.
The Department for Farming, Agriculture, and Rural Affairs (-2.3%) is also expected to see significant cuts over the next three years, as is the Foreign, Commonwealth and Development Office (-8.3%), although in the latter case that is principally driven by the decision to reduce overseas development assistance from 0.5% of GDP to 0.3% of GDP although some will come from back office savings.
Not shown in the chart are small and independent bodies and the government legal function, which are together expected to increase by 0.4% a year on average, although this comprise a -0.5% annual reduction in the former and a 5.3% average annual increase in the latter. The net changes after inflation are a fall of less than £0.1bn and an increase of just over £0.1bn respectively, which are rounding errors in the hundreds and hundreds of billions of pounds spent by government departments each year.
Reading the Spending Review 2025 is a good way of understanding the current government’s priorities expressed in financial terms. A lot more money for defence and the NHS, substantial sums for business and the justice system, and significant cuts in international development, asylum handling, agriculture and administration costs. There’s some money for transport and housing, but that’s offset by savings from HS2 and other activities.
The ICAEW chart of the week this week is on the topic of the residential housing market, one of the swathe of economic statistics published by the Office for National Statistics last week.
While there is often great interest in what is happening to house prices, data on the number of transactions tends to get less publicity – despite perhaps being more important to the economy. After all, people moving home often generate a great deal of additional economic activity, such as redecorating and buying new furniture.
There were 856,000 housing sales in the year ended 30 September 2018, down from 948,000 in 2016 and 36% lower than the pre-crisis peak of 1,340,000 in 2007.
Much of the decline in the volume of transactions has been put down to the weak economic recovery, with low real family incomes making it difficult for many to buy, despite extremely low mortgage rates. Another culprit may be stamp duty, a friction in the housing market as it significantly increases the cost of moving home.
The total value of the transactions in 2018 was £253bn, meaning that the average price paid for house in England & Wales was £296,000.
The statisticians prefer to focus on the median value, which was £232,000 in 2018. The ONS uses this to calculate affordability, with the ratio to gross annual earnings at 7.83 in 2018, up from the 7.77 seen in 2017. Surprisingly this is higher than the 7.17 calculated for the peak in 2007, which in turn was significantly higher than the ratio of 4.13 back in 2000.
With politicians of all parties keen to increase housing supply, the hope is that more people will be able to get on the housing ladder and the volume of transactions will start to increase again. Whether that will actually happen remains to be seen.