My chart for ICAEW this week looks at how business confidence has entered negative territory, driven by uncertainty about both the economic outlook and potential tax rises.
One of the major themes of ICAEW’s growth campaign is how uncertainty for businesses can be tackled in order to improve business sentiment and hence the appetite of businesses to invest.
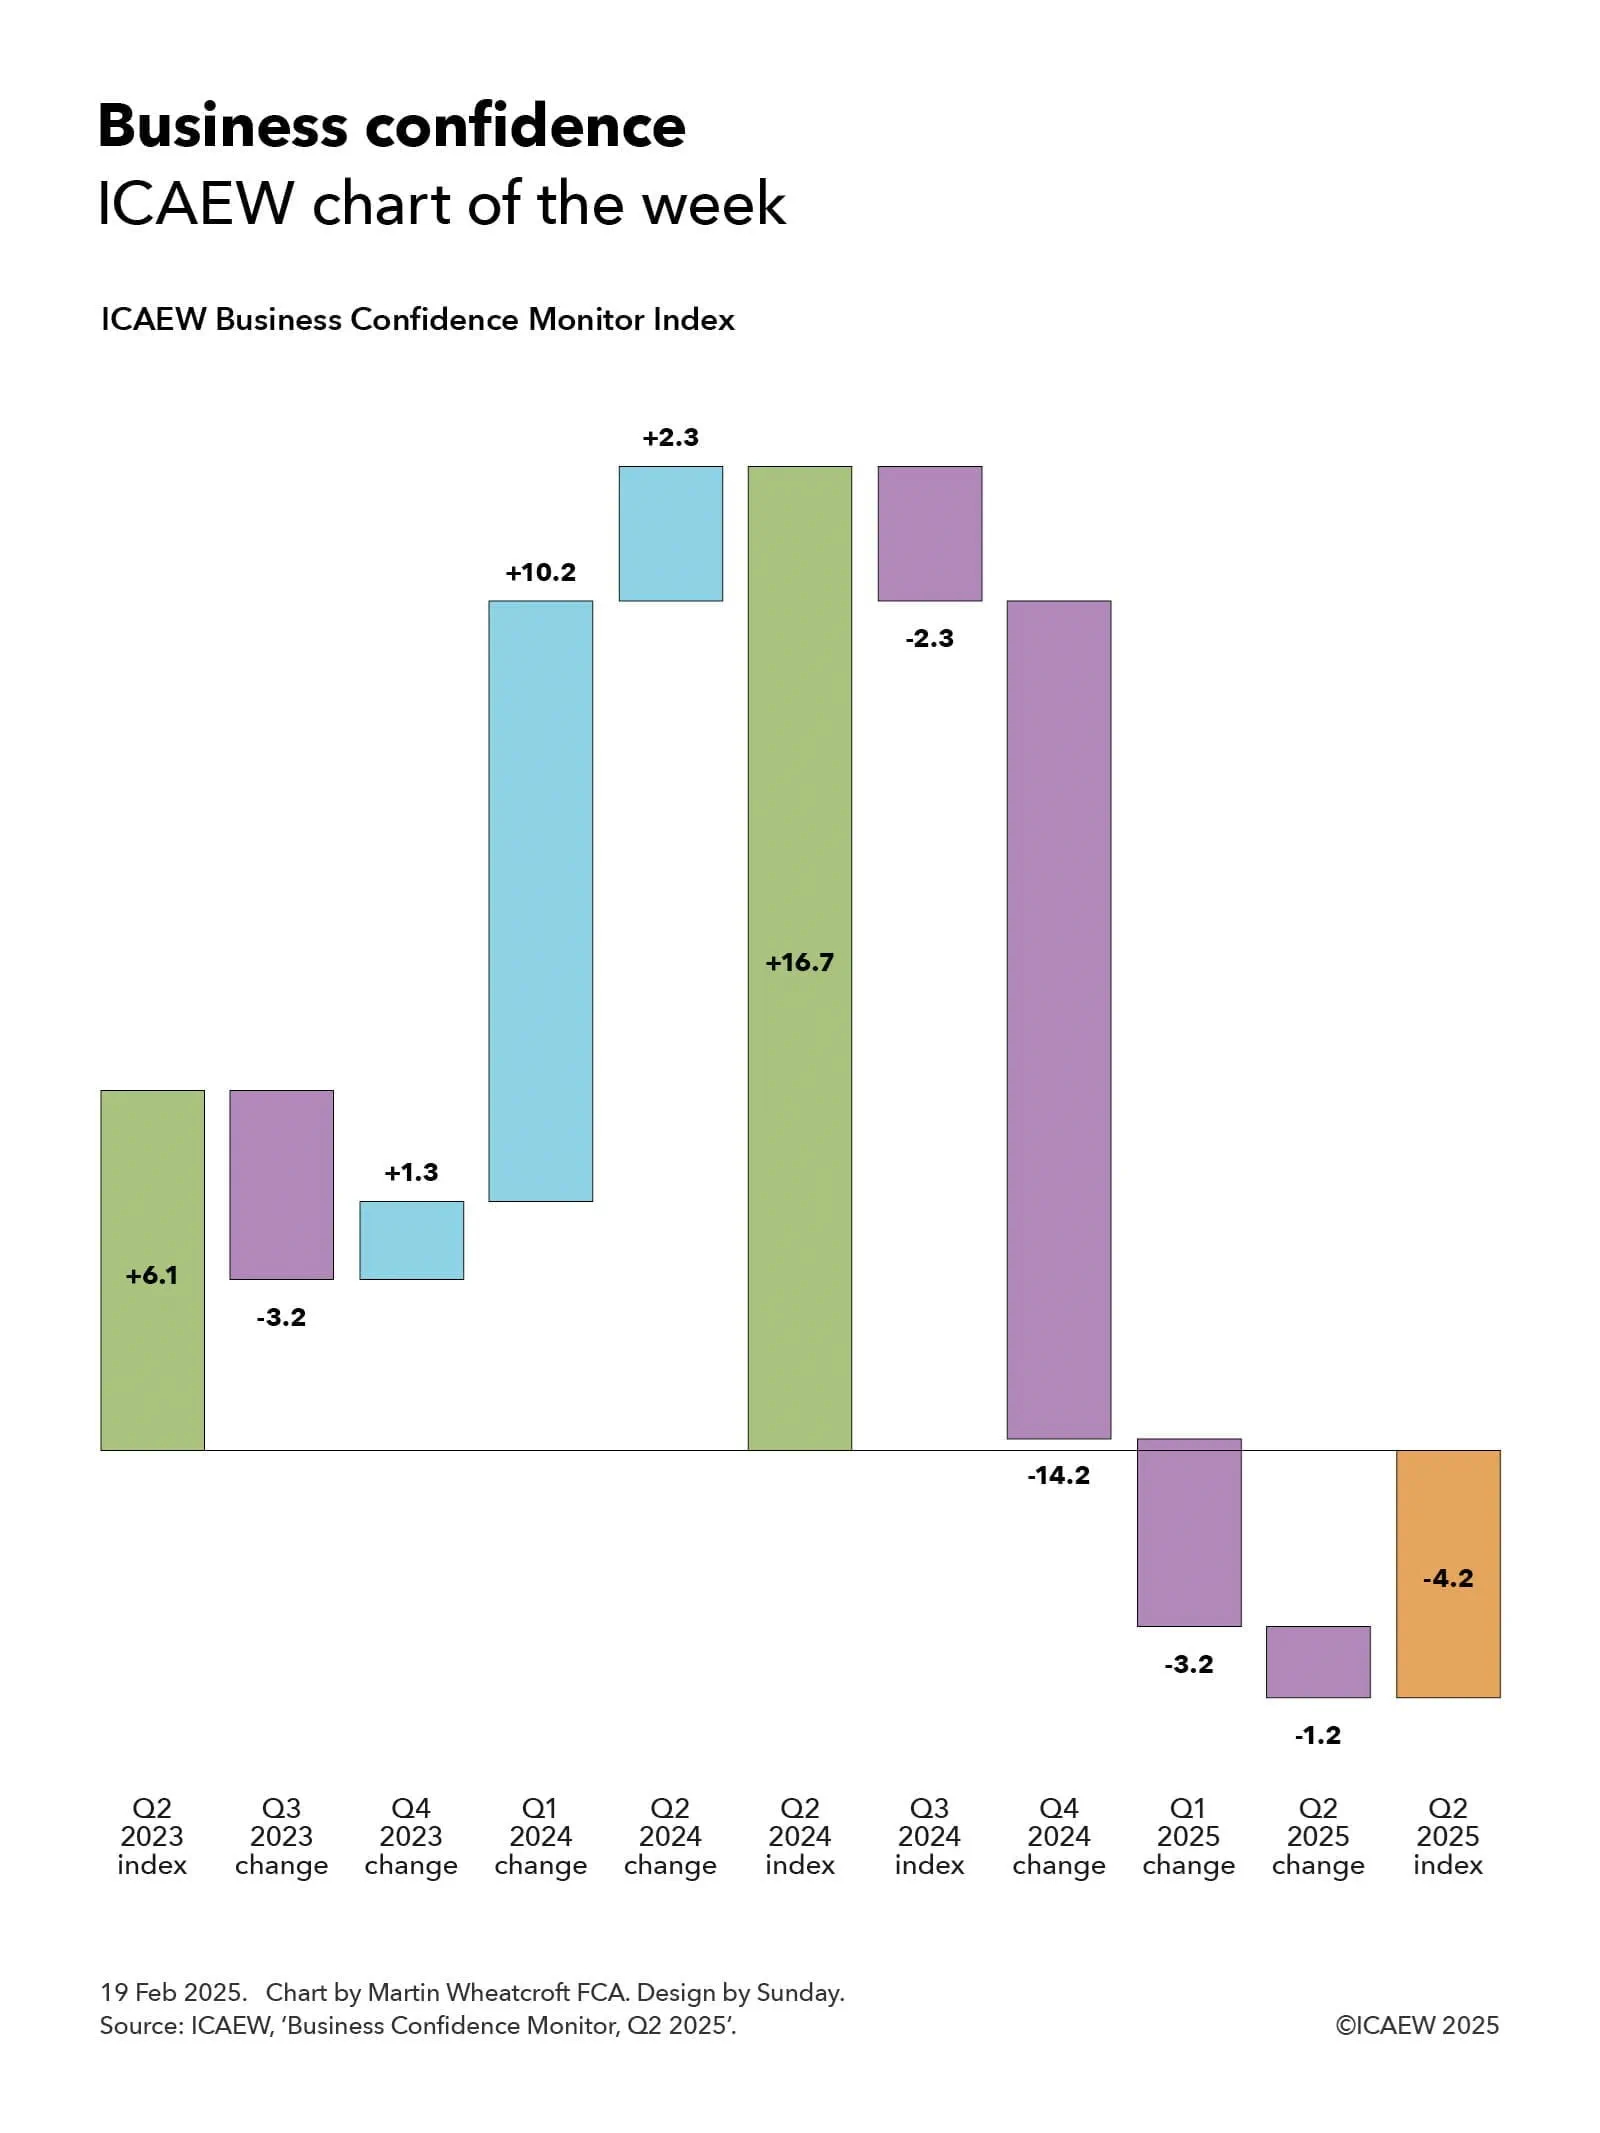
My chart for ICAEW this week highlights how business confidence as measured by the ICAEW Business Confidence Monitor (BCM) Index rose from +6.1 in the second quarter 2023 to +16.7 a year later, before crashing over the past year to -4.2 in Q2 2025.
The +6.1 score in Q2 2023 was a significant improvement over the -20.1 registered half a year earlier in Q4 2022 at the height of the cost-of-living crisis. It was also better than the +4.1 pre-pandemic average and +5.0 overall average measured by the BCM Index.
As the chart shows, the index declined in Q3 2023 by -3.2 (to 2.9) but then rose by 1.3 in Q4 2023 (to 4.2), by 10.2 in Q1 2024 (to 14.4), and by a further 2.3 in the second quarter of 2024 to reach a peak of 16.7 following the general election and the consequent change in government.
Unfortunately, business sentiment has declined rapidly over the past year, with the BCM Index falling by 2.3 in Q3 2024 (back to 14.4) and by a huge 14.2 in the fourth quarter last year (to 0.2, only just positive). The index turned negative this year with a decline of 3.2 in Q1 2025 (to -3.0) and then a further fall of 1.2 in Q2 2025 to reach a score of -4.2 in the most recent calendar quarter.
According to the BCM commentary, the business sentiment score of -4.2 in Q2 2025 marked a fourth consecutive decline during a period of heightened global uncertainty and weakening UK activity. Confidence among exporters was particularly downbeat, falling into negative territory for the first time in almost three years.
Domestic sales growth had slowed during the second quarter and businesses had lowered their expectations about domestic and exports sales for the coming year. Concerns about customer demand and competition in the marketplace had risen sharply, while regulatory requirements continued to be the second biggest challenge for businesses.
The tax burden remained the greatest growing challenge in Q2 2025, with the reported rate close to the survey high, and these concerns rose to new record highs in some key sectors.
Expectations for employment growth in the year ahead dropped to the lowest level since Q3 2020, but businesses expected salary growth to continue to ease, adding to the more positive outlook for inflationary pressures than reported in the previous quarter.
Confidence declined in most sectors surveyed and sentiment remained highly unequal, with confidence most negative in manufacturing and engineering, and retail and wholesale; and most positive in information and communication, and construction.
More detail about business confidence by sector and by regions is available in the ICAEW Business Confidence Monitor section of the ICAEW website.
More detail on how it is too difficult, expensive and uncertain to do business in the UK, and ICAEW’s call for the government to do what it can to streamline regulations, reduce unnecessary costs, and provide businesses with the confidence that they need to invest, is available on ICAEW’s growth campaign.
Our chart this week asks whether the recent low rate of growth in numbers of businesses registered for PAYE and VAT is linked to the increasing difficulty of doing business in the UK.
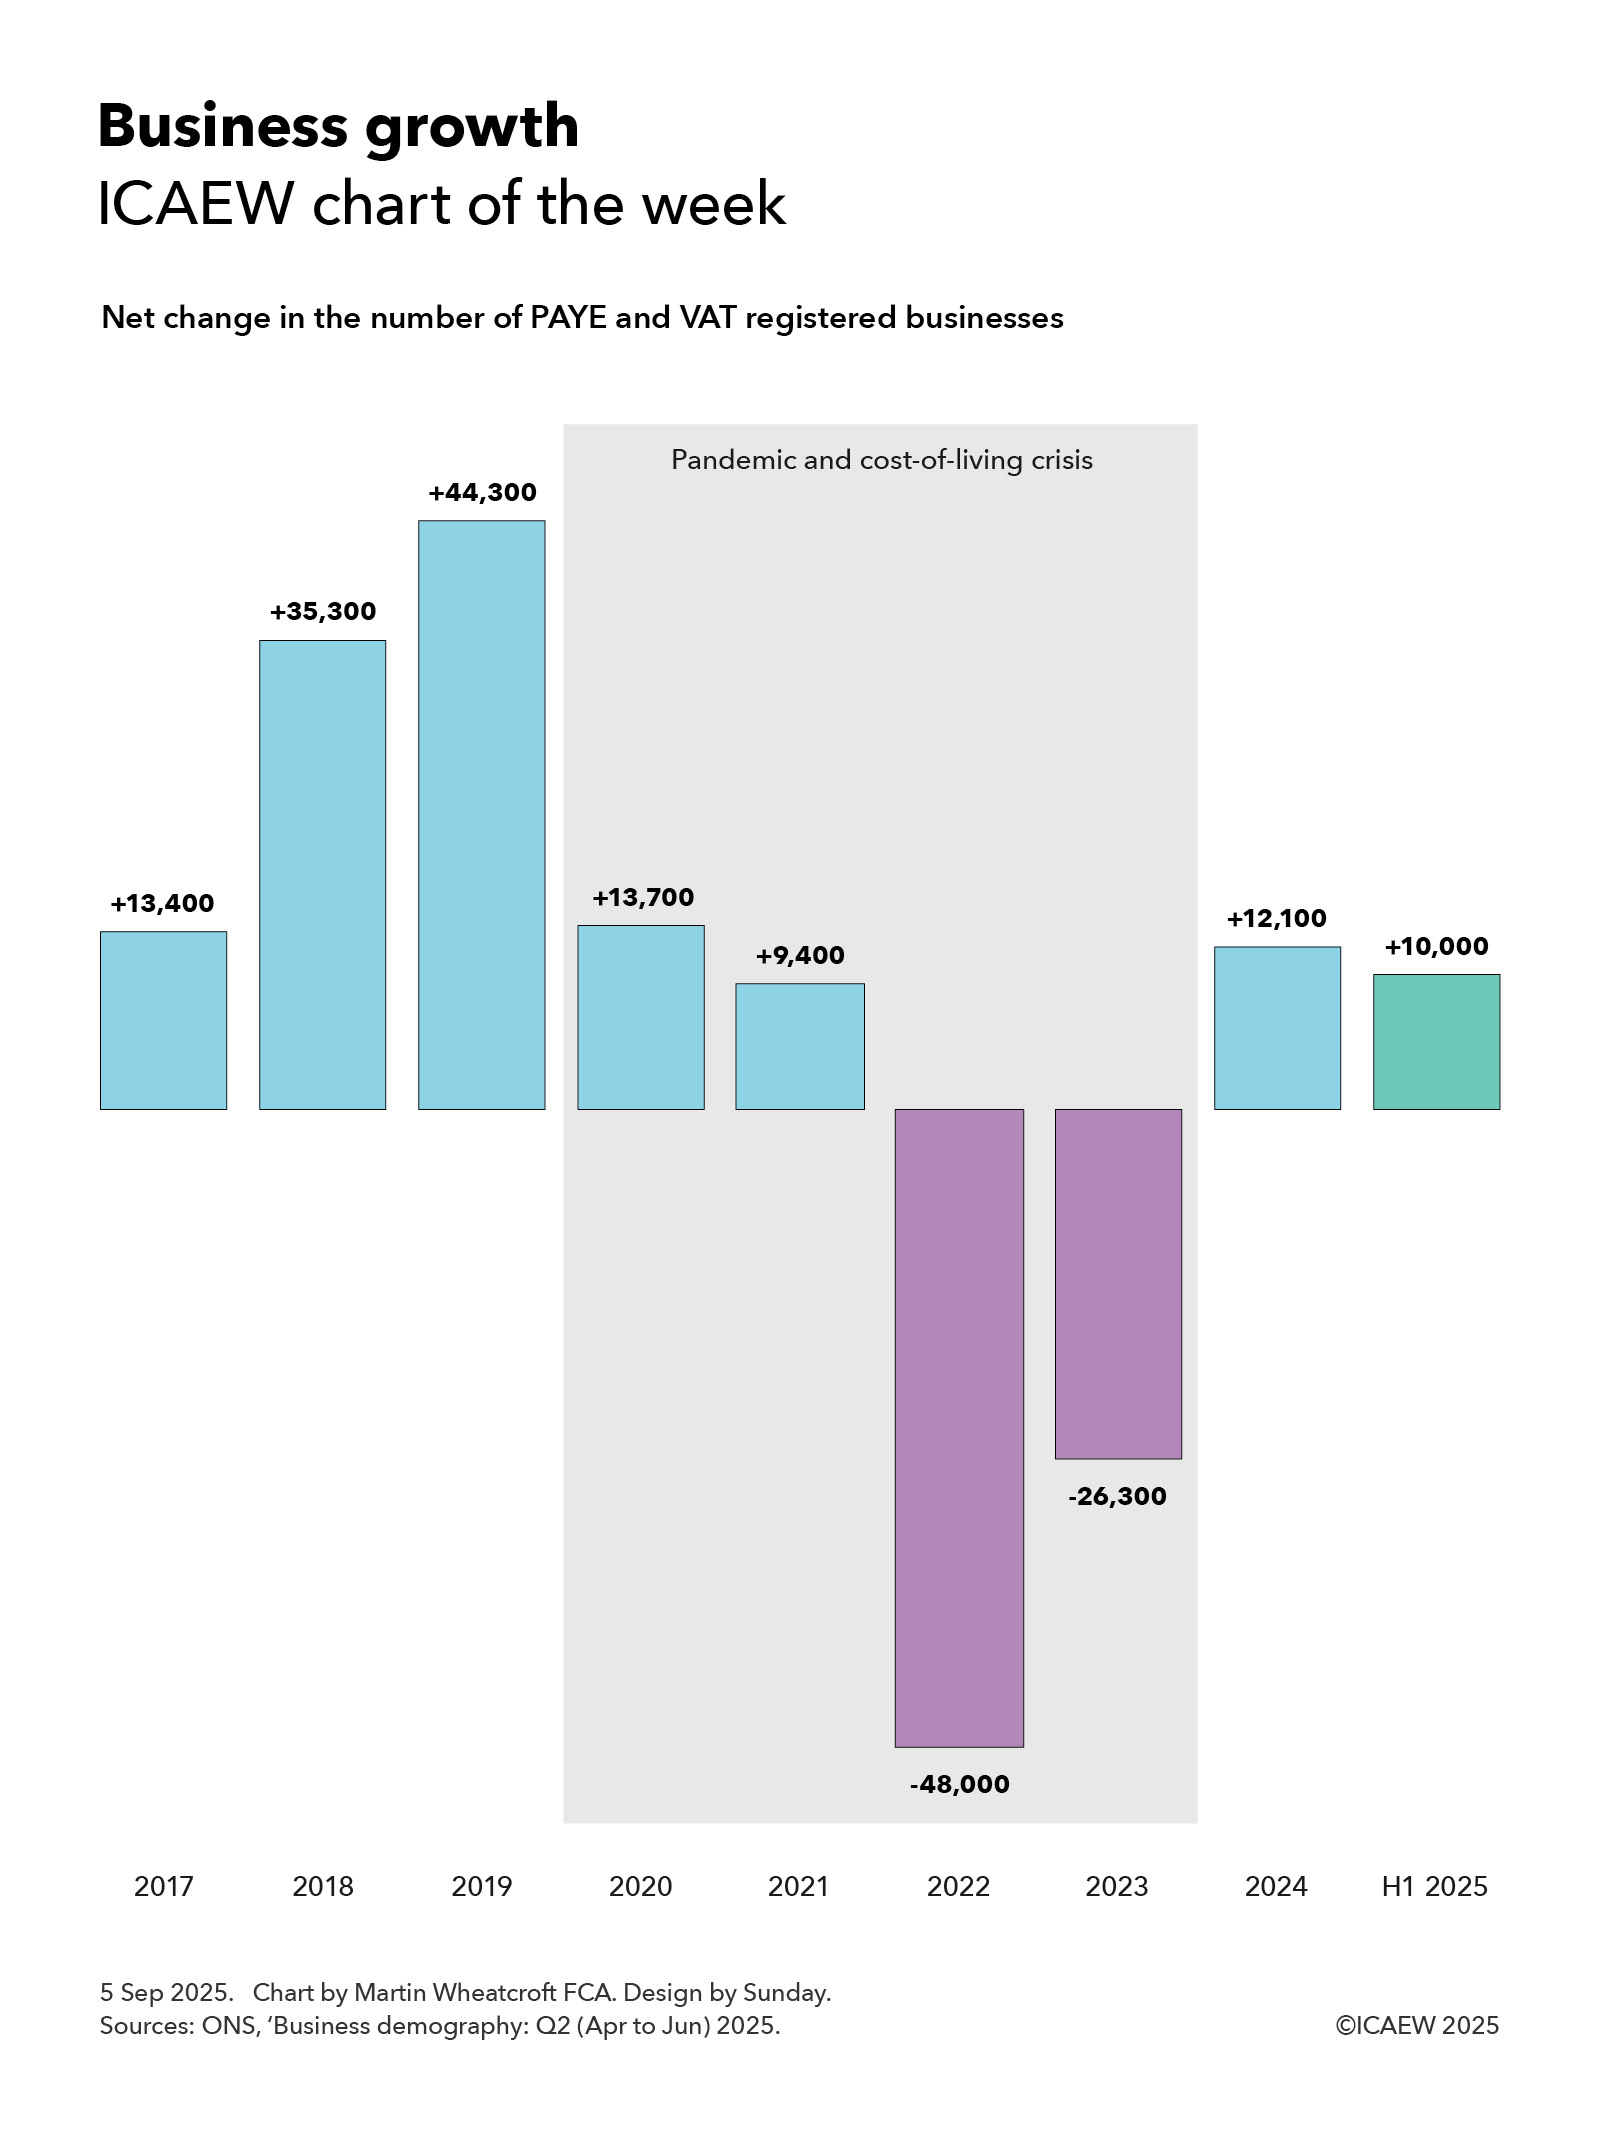
According to the Office for National Statistics, there were net additions of approximately 13,400, 35,300 and 44,300 to the UK inter-departmental business register in 2017, 2018 and 2019 respectively. This was followed by net additions of 13,700 and 9,400 in 2020 and 2021 during the pandemic and then net reductions of 48,000 and 26,300 in 2022 and 2023 during the cost-of-living crisis.
The register started growing again in 2024 with net additions of 12,100, followed by a net increase of approximately 10,000 in the first half of 2025. This rate of increase is significantly lower than the average rate of net business formation before the pandemic but is a significant improvement over the net contraction in the number of businesses in 2022 and 2023 during the cost-of-living crisis.
The net changes are equivalent to 0.5%, 1.3%, 1.6%, 0.5%, 0.3%, -1.7%, -1.0% and 0.4% in the total number of registered businesses in 2017 to 2024 respectively and annualised growth of 0.7% in the first half of 2025.
The total number of PAYE and VAT registered businesses is projected to have reached around 2.75m in June 2025, based on the last published count for March 2024 plus reported movements since then. This is out of an overall total of somewhere in the region of 5.5m businesses in the UK, with the difference mainly due to single-person companies and sole traders that do not employ any staff and operate below the VAT threshold of £90,000 per year.
The approximately 2.75m registered businesses can be analysed into just under 2.1m companies and other types of corporations, approximately 400,000 sole proprietors, 150,000 or so partnerships, and around 100,000 non-profit bodies, mutual associations and public sector organisations. Approximately 945,000 registered businesses are in London and the South East, 675,000 are in the Midlands and the East of England, 535,000 in the North of England, 340,000 in the South West of England and Wales, 175,000 in Scotland, and 80,000 in Northern Ireland.
Business births between 2017 and 2024 were approximately: 338,700; 341,100; 355,700; 322,000; 354,300; 327,500; 307,100; and 310,100; there were 167,600 in the first half of 2025. Business deaths in 2017 to 2024 were: 325,300; 304,800; 311,400; 308,300; 344,900; 375,500; 333,400; and 298,000; with 157,600 in the first half of 2025.
The overall change in the total number of registered businesses between 2017 and the first half of 2025 was 63,900, an average of 7,500 or 0.3% a year over eight and a half years, comprising an annual average of 332,100 business births less 324,600 business deaths in that time.
The chart highlights both the very difficult economic times we have been through in the past few years with the pandemic and cost-of-living crisis and the current period of weak economic growth that has yet to return to pre-pandemic levels.
One of the key ways that we can increase the rate of net business formation is to make it easier to do business in the UK, as discussed in ICAEW’s growth campaign. This asks why it is too difficult, too expensive and too uncertain to do business in the UK today and suggests ways the government can streamline regulation, reduce costs and unnecessary frictions, and provide businesses with greater confidence to invest and grow.
My chart for ICAEW this week looks at the government’s priorities as expressed through departmental budgetary allocations over the next three years.
The Spending Review 2025 establishes base operating budgets for government departments for the three financial years from 1 April 2026 (2026/27, 2027/28 and 2028/29) and base capital budgets for four financial years (extending to 2029/30).
Departmental budgets for the current financial year ending on 31 March 2026 (2025/26), total £648bn and are expected to rise to £678bn in 2026/27, £697bn in 2027/28, and £717bn in 2028/29, an increase of 10.6% over the three years or 3.4% a year. This is equivalent to an average increase of 1.5% a year in real terms after adjusting for inflation of 1.9% a year on average over the spending review period.
The totals can be analysed between operating or ‘day-to-day’ budgets of £517bn, £536bn, £552bn and £568bn in 2025/26, 2026/27, 2027/28 and 2028/29 respectively and capital budgets of £131bn, £143bn, £145bn and £149bn. These are real terms increases of 1.2% and 2.4% a year on average over three years.
The capital budget in 2029/30 is £152bn, a cut in real terms that reduces the average annual increase in capital budgets over four years to 1.8% a year on average.
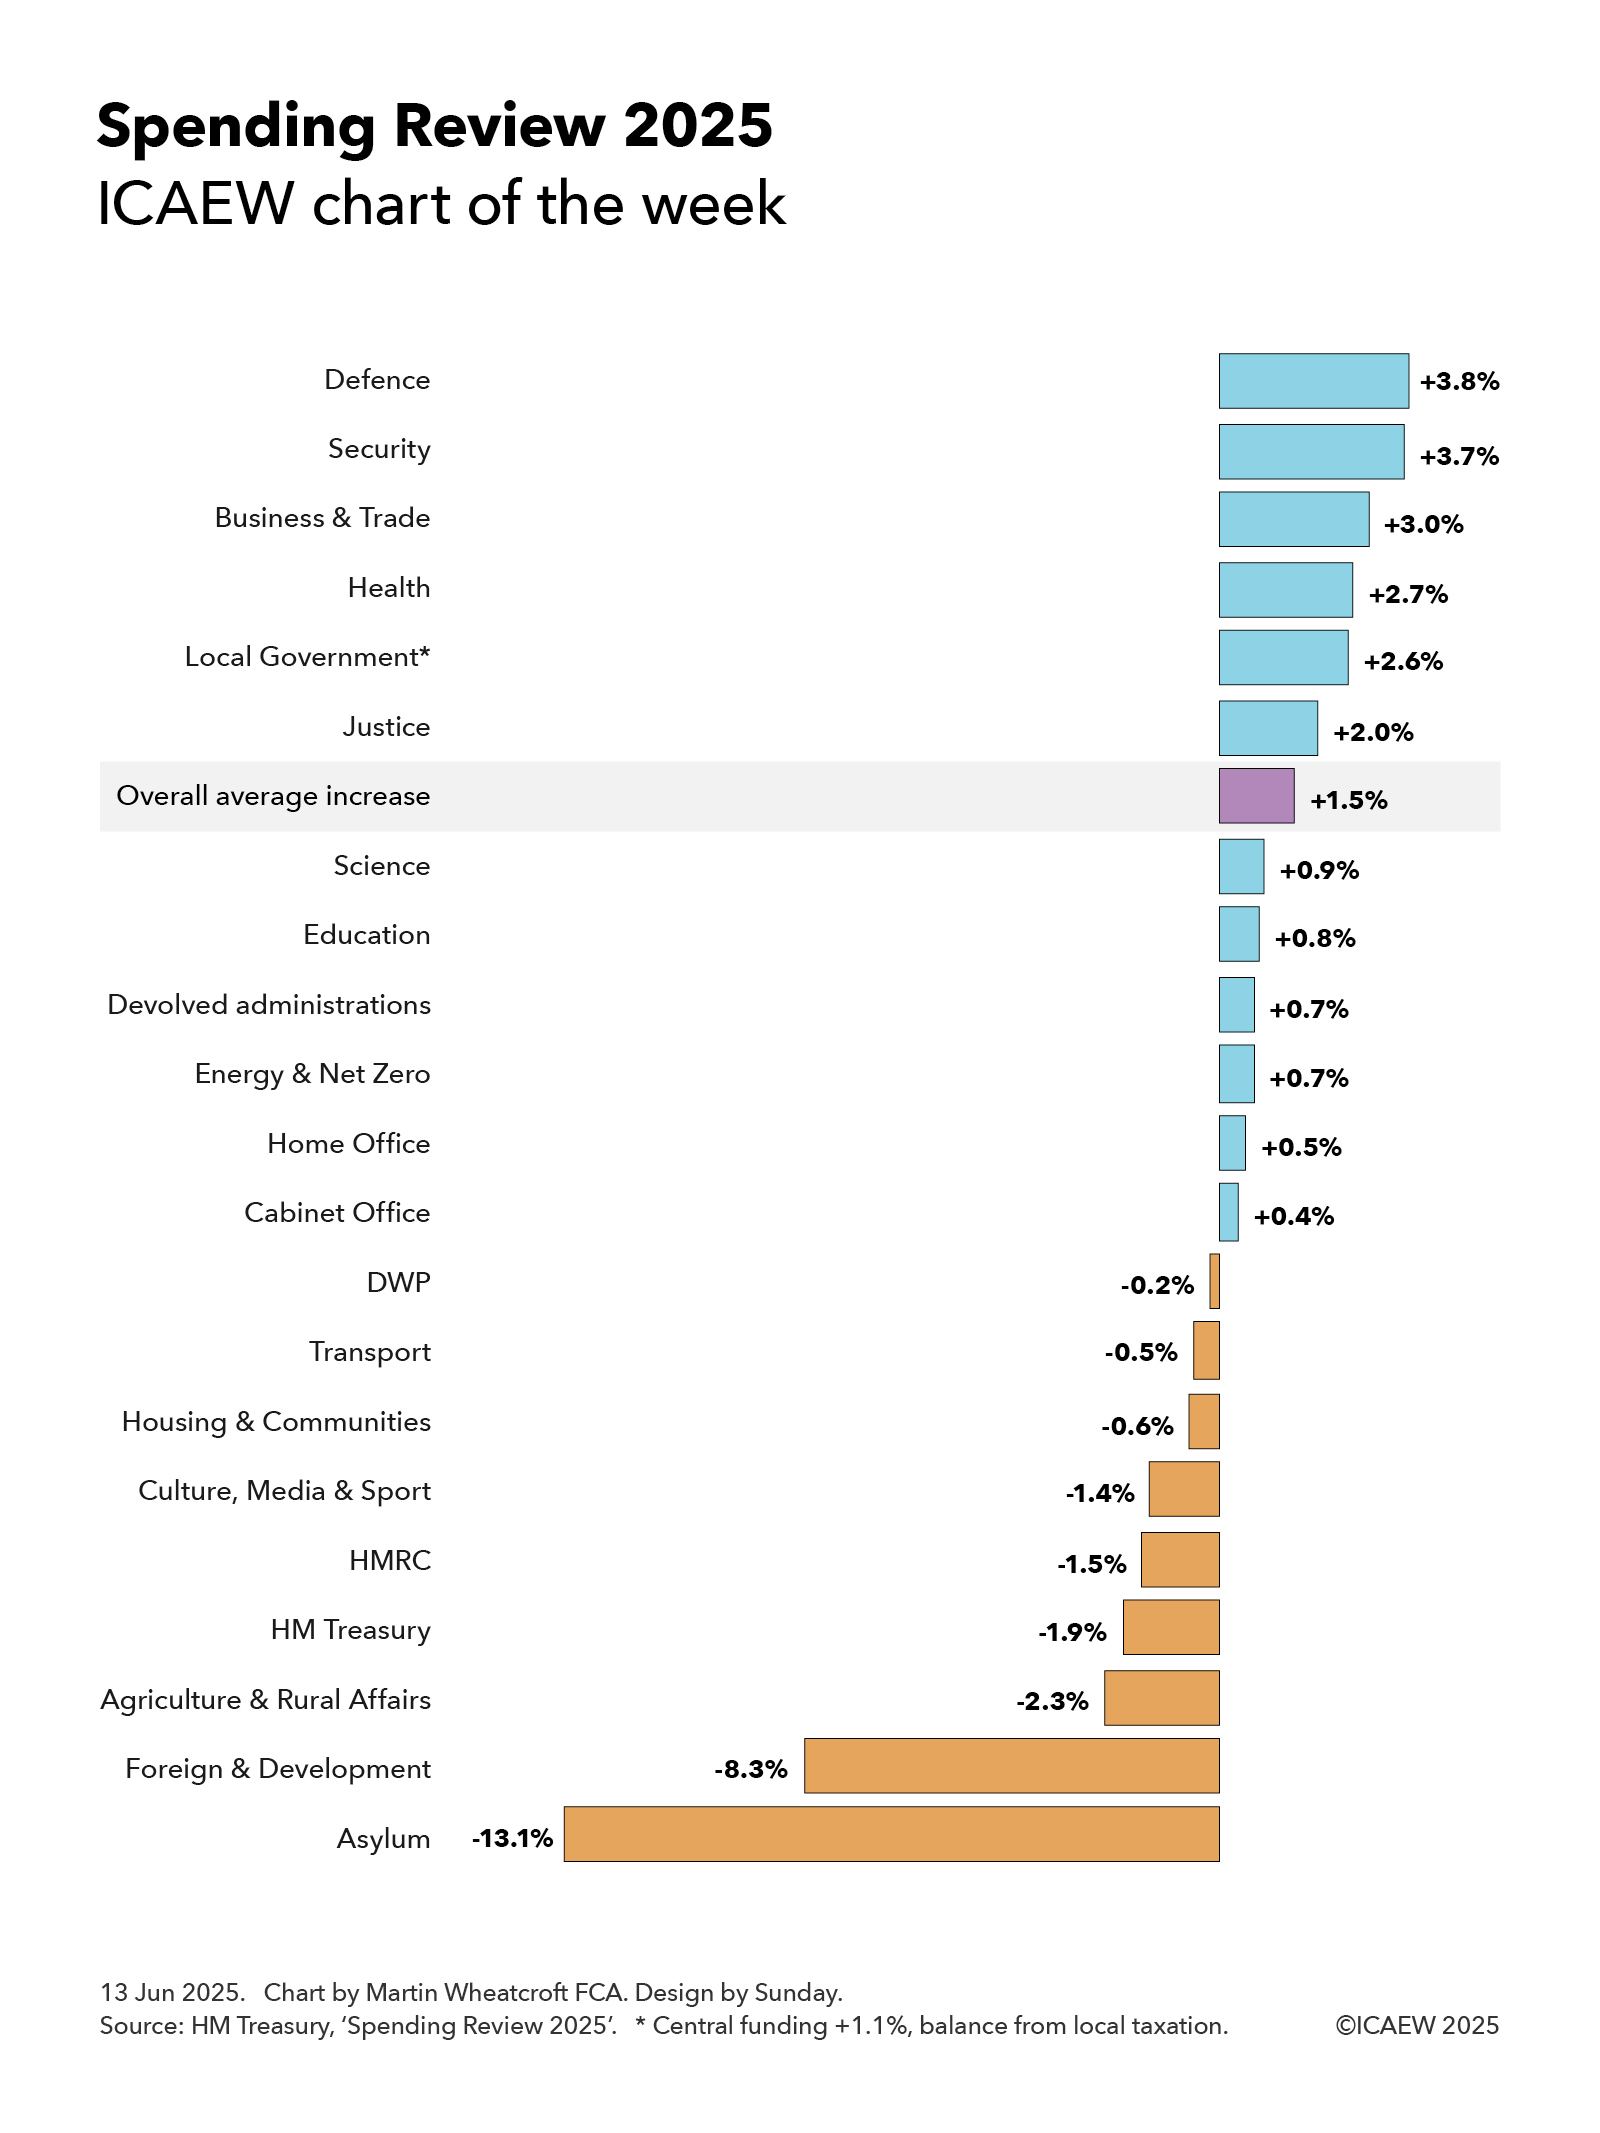
My chart this week highlights how the 1.5% average annual real increase over three years in total budgets (operating and capital) has been allocated across departments, starting with the Ministry of Defence, which leads the pack with an average increase in its budget of 3.8% a year, followed closely by the security services, with an average annual increase of 3.7%. This reflects the elevation of national defence and security to the top of the government’s priorities since the general election last year, even though this increase will only move defence and security spending from 2.3% of GDP currently to 2.6% of GDP by 2027, a long way off the proposed 3.5% of GDP new minimum to be discussed at the NATO summit.
Economic growth and the NHS are the next highest priorities for the government and so it is perhaps unsurprising that the Department of Business & Trade does well with an annual average increase of 3.0%, closely followed by the Department of Health & Social Care, which receives 2.7%. The latter is the biggest increase in cash terms, at £31bn in total or about £12bn more in 2028/29 after adjusting for inflation.
Local government finances are in a parlous state and so the government has pencilled in a 2.6% average annual increase in core budgets for local authorities in England over the next three years. However, it is only increasing central funding by 1.1% a year on average, implying the balance will need to be made by local taxation, principally council tax.
The Ministry of Justice has been awarded 2.0% a year on average as the government seeks to tackle significant backlogs in the courts, overcrowded prisons and significantly under-resourced probation services.
The Department of Science, Innovation and Technology has received a below average annual increase of 0.9% over the next three years, but this follows an almost 12% increase over the past two years as the government has sought to increase investment in research and development to boost economic growth.
Despite being a key priority for the government, the Department for Education has only received a 0.8% average annual increase, partly because of falling primary school rolls in line with a significant fall in the birth rate over the last decade.
The devolved administrations – Scotland (0.8%), Wales (0.7%) and Northern Ireland (0.5%) – are budgeted to receive an average of 0.7% a year over three years as a consequence of the Barnett formula that links UK national government spending in England to the block grants provided to each devolved administration, adjusted for relative changes in population among other factors.
The Department for Energy Security and Net Zero is budgeted to receive 0.7% on average over three years, although this translates into an average annual increase of 2.7% a year once the UK government’s one-off (but long running) investment in the Sizewell C nuclear power plant is excluded. The latter peaks in the spending review period, but then starts to fall.
The Home Office is scheduled to receive a below average increase of 0.5% a year, although the government notes that core police operating budgets should go up by 1.7% once the contribution from local taxation is factored in. This increase also excludes spending on asylum seekers, a big item within the Home Office budget that is expected to fall by a real term average of 13.1% a year over three years as the backlog in asylum claims is tackled and lower cost alternatives to housing claimants in hotels are found.
The Cabinet Office is expected to receive just 0.4% on average reflecting the contribution that planned efficiency savings are expected to contribute to administrative budgets. This is also the reason for the 0.2% a year real-terms fall in the Department for Work and Pensions (DWP) budget as automation helps reduce the cost of administering the welfare system.
The budget of the Department for Transport is expected to fall by 0.5% a year overall, but this partly reflects a fall in spending on High Speed 2 as it comes closer to completion. If that is excluded, the department’s budget is expected to increase by 0.5% a year on average. The actual increase in spending should be even higher, as the budget is net of passenger revenues that are expected to grow at a faster rate over the next three years.
Extra money for housing was found within the spending review, but this wasn’t enough to stop the budget for the Department of Housing, Communities and Local Government from shrinking by an annual average of 0.6% a year as other activities are cut back, while the Department for Culture, Media & Sport (-1.4% a year on average) has also been asked to cut back its activities.
HMRC (-1.5% a year) and HM Treasury (-1.9% a year) see their budgets reduced significantly, with digitisation and efficiency savings expected to contribute significant sums.
The Department for Farming, Agriculture, and Rural Affairs (-2.3%) is also expected to see significant cuts over the next three years, as is the Foreign, Commonwealth and Development Office (-8.3%), although in the latter case that is principally driven by the decision to reduce overseas development assistance from 0.5% of GDP to 0.3% of GDP although some will come from back office savings.
Not shown in the chart are small and independent bodies and the government legal function, which are together expected to increase by 0.4% a year on average, although this comprise a -0.5% annual reduction in the former and a 5.3% average annual increase in the latter. The net changes after inflation are a fall of less than £0.1bn and an increase of just over £0.1bn respectively, which are rounding errors in the hundreds and hundreds of billions of pounds spent by government departments each year.
Reading the Spending Review 2025 is a good way of understanding the current government’s priorities expressed in financial terms. A lot more money for defence and the NHS, substantial sums for business and the justice system, and significant cuts in international development, asylum handling, agriculture and administration costs. There’s some money for transport and housing, but that’s offset by savings from HS2 and other activities.
My chart for ICAEW this week illustrates how company dissolutions continue to outpace incorporations as the economy remains in first gear.
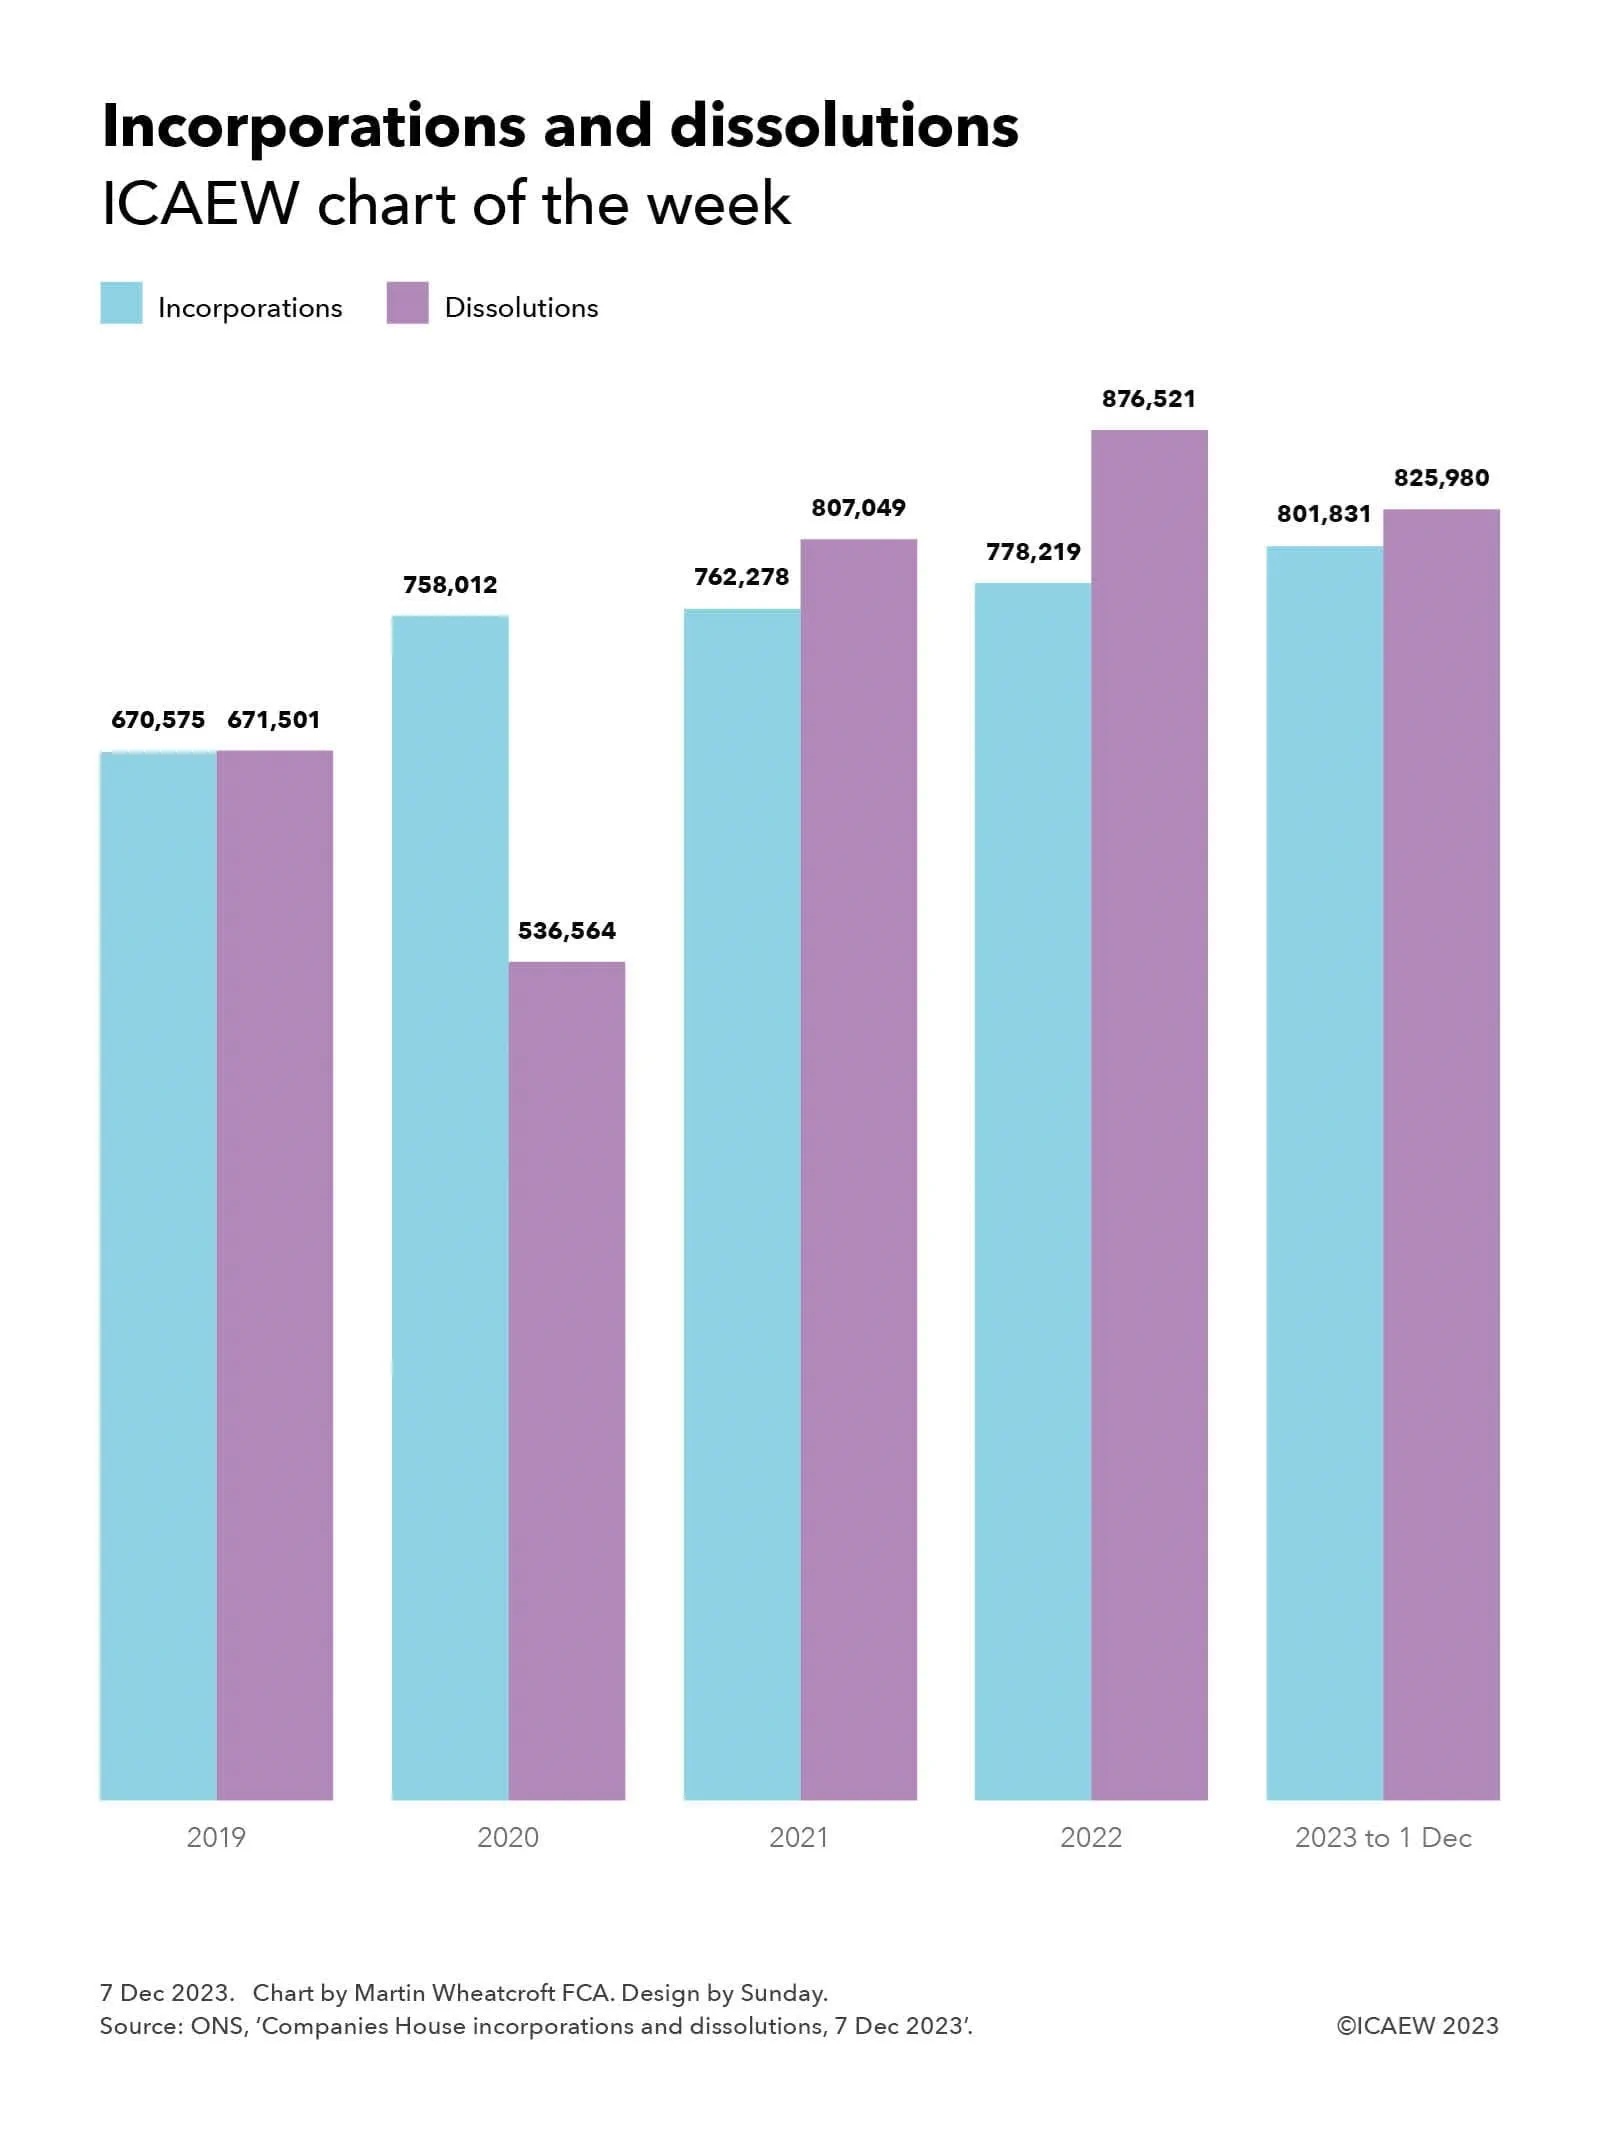
A key indicator for the health of the economy is the comparison between how many companies are created each year and the number that are dissolved, and our chart this week illustrates how these compare over the last four years up until 1 December 2023.
In 2019 there were 670,575 company incorporations and 671,501 dissolutions (391,066 compulsorily and 280,435 voluntarily), a net contraction in the number of companies of 926, consistent with the rather tepid economy we were experiencing in the year before the pandemic.
The numbers for 2020 were distorted by the pandemic, with incorporations rising to 758,012 and dissolutions falling to 536,564 (275,933 compulsorily and 260,631 voluntarily) – a net increase of 221,448. The rise in incorporations was no doubt contributed to by people deciding to start new businesses during lockdown, although bulk incorporations may also have been a factor. The significant fall in companies dissolved in 2020 compared with the previous year reflects government support on offer during the pandemic that propped up many companies that would otherwise have failed during 2020.
Incorporations rose further to 762,278 in 2021 and 778,219 in 2022, but these gains were more than offset by a sharp rise in dissolutions, which jumped to 807,049 (508,448 compulsorily and 289,604 voluntarily) in 2021 and 876,521 (572,646 compulsorily and 304,875 voluntarily) in 2022 as government support was withdrawn and reality caught up with many companies. Extremely high energy costs and high inflation were key factors in the demise of many businesses over this period. The net decrease in the number of companies was 44,771 in 2021 and 98,202 in 2022.
The number of companies incorporated during the first 11 months of 2023 was 801,831, a 9% rise on the equivalent period last year, while 825,980 companies were dissolved (539,643 compulsorily and 286,337 voluntarily), a rise of less than 1%. This has narrowed the gap to a contraction of 24,149 companies in the first 11 months of 2023.
While these numbers may be accurate to the nearest digit (unlike most sample-based statistics), their meaning for the economy is much less precise. Many companies are incorporated but never go on to trade, while some incorporations are merely a corporate wrapper around an existing business, or with personal service companies they can be a conversion of economic activity from one legal form to another. Unfortunately, companies are also sometimes incorporated for fraudulent purposes. Similarly, companies are wound up for a range of reasons and not just because they are all the consequence of failing businesses.
Despite that, they do provide a helpful indicator on what is going on with the economy, as the ‘cycle of business life’ is played out. For example, in theory it should be positive that even after a post-pandemic ‘shakeout’ the total number of companies over the period from 2019 to 1 December 2023 has grown by 53,300.
This may also be a statistic worth watching in 2024 as Companies House uses its new powers to weed out companies in the register. Just how significant will the introduction of new verification procedures and more active enforcement activity be to numbers of companies being incorporated and dissolved each year?
My chart this week looks at the 1.5% drop in the number of VAT- and PAYE-registered businesses in the year to 31 March 2023.
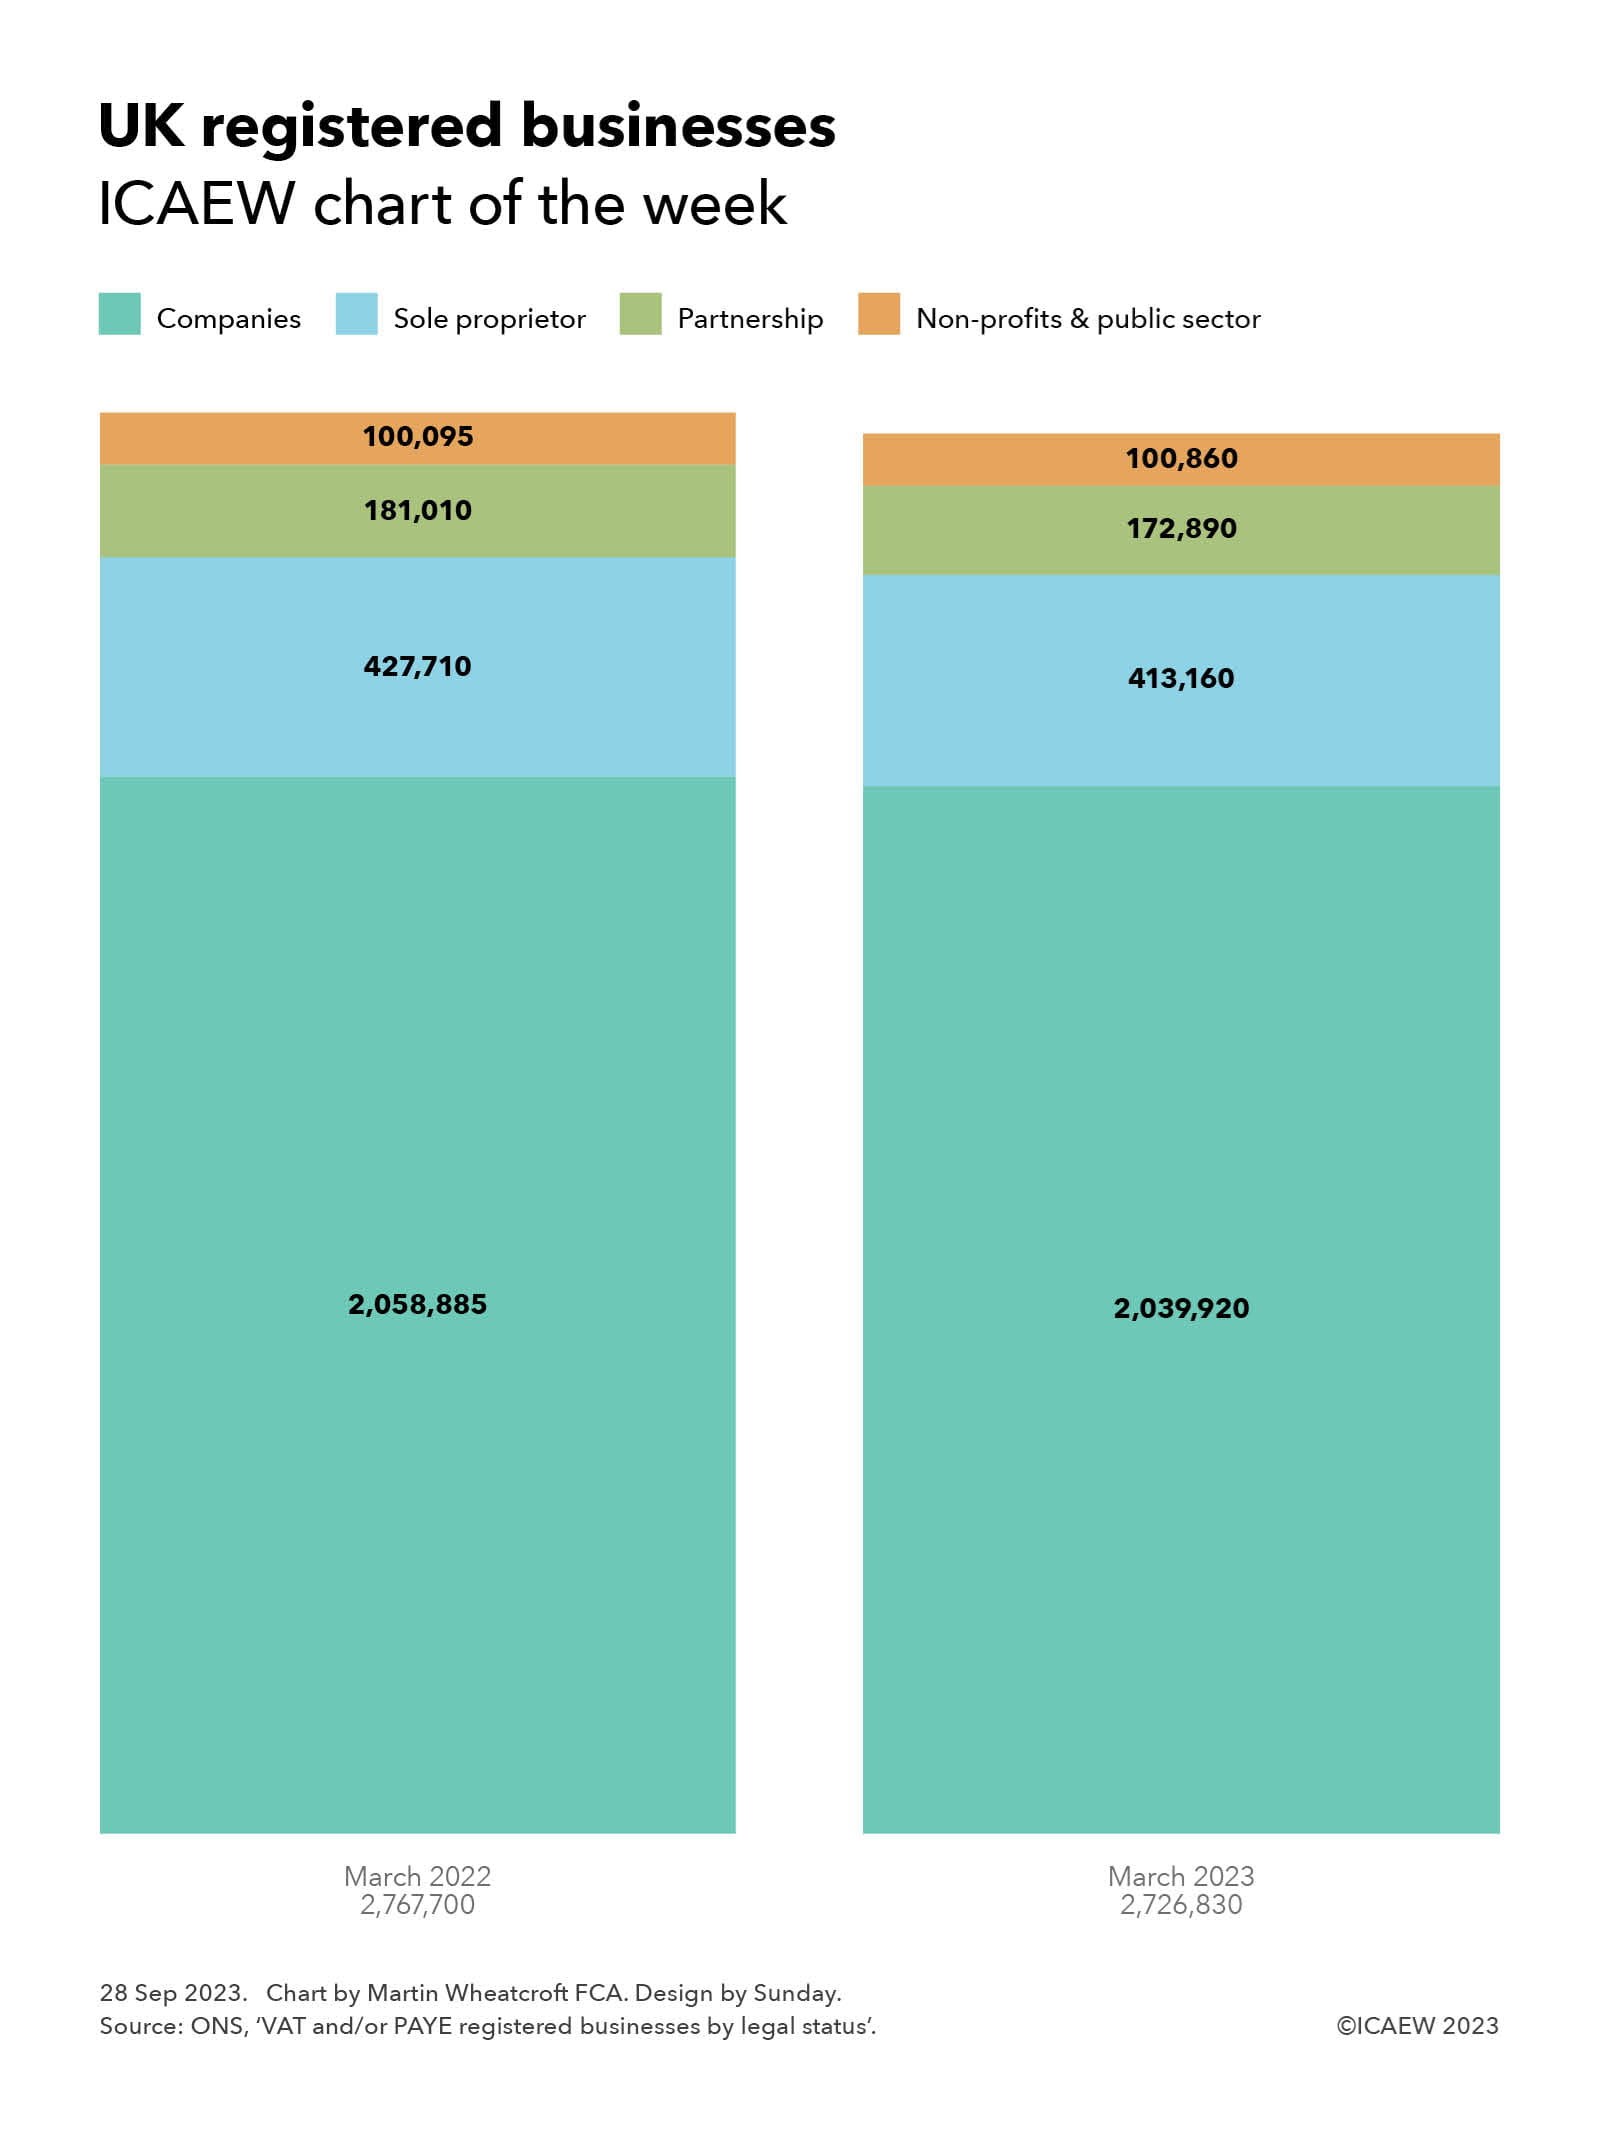
On 27 September 2023, the Office for National Statistics (ONS) published data on the 2,726,830 businesses that were registered for VAT and/or PAYE in the UK as of March 2023, a 1.5% fall from the 2,767,700 businesses that were registered a year previously.
As illustrated by our chart this week, the number of VAT- and PAYE-registered companies fell by 0.9% from 2,058,885 to 2,039,920, sole proprietorships fell by 3.4% from 427,710 to 413,160, and partnerships fell by 4.5% from 181,010 to 172,890.
Bucking the trend were non-profit bodies, mutual associations and public sector organisations, which rose by 0.8% from 100,095 to 100,860. The latter comprised 88,375 non-profit bodies and mutuals, 9,030 local authority entities, 3,280 central government entities and 175 public corporations and other publicly owned businesses, as of March 2023.
Not shown in the chart are in the order of 2.8m ‘unregistered’ businesses that are not registered for VAT or PAYE. Most of these are self-employed individuals, sole traders, or one-person companies that generate revenue below the VAT threshold of £85,000 and do not have any payrolled employees.
The number of registered businesses in March 2023 by industry group are comprised as follows:
415,250 professional, scientific and technical (down 3.7% on March 2022);
402,165 motor trades (-2.8%);
377,585 construction (+0.7%);
226,285 business administration and support services (-1.1%);
187,360 information and communication (-4.5%);
184,420 arts, entertainment, recreation and other services (+2.0%);
174,830 accommodation and food services (-0.2%);
151,710 production (-1.8%);
141,390 agriculture, forestry and fishing (-0.8%)
128,600 transport and storage including postal (-6.9%);
113,785 (+2.8%) property, 109,095 health (+2.8%);
59,210 finance and insurance (-2.0%);
47,340 education (+1.3%); and
7,805 public administration and defence (+0.4%).
There were 2,115,105 businesses with between zero and four employees as of March 2023, followed by 313,780 (five to nine employees), 157,955 (10-19), 86,285 (20-49), 27,660 (50-99). 15,135 (100-249) and 10,910 (250+).
By turnover band, the numbers as of March 2023 were: 445,020 (£0-£49,999); 563,610 (£50,000-£99,999); 846,615 (£100,000-£249,999); 367,315 (£250,000-£499,999); 222,155 (£500,000-£999,999); 123,995 (£1m-£2m); 85,655 (£2m-£5m); 32,100 (£5m-£10m); 29,080 (£10m-£50m); and 9,285 (£50m+).
The fall in the number of businesses in 2022/23 is perhaps not surprising given the significant amount of support provided to many businesses during the pandemic, which will have delayed the normal process of business closure during the previous two years. Meanwhile, the cost-of-living and energy crises will have also made it difficult for some businesses to survive in the year to March 2023. Even though energy prices have come down, the cost-of-living crisis and consequent reductions in consumer demand could see further businesses fail during 2023/24.
My chart this week illustrates the choppy economic waters facing UK businesses as more stopped trading than were created over the course of 2022.
The Office for National Statistics (ONS) published its latest quarterly experimental statistics on business births and deaths on 2 February 2023. This reports that business closures have increased since before the pandemic at the same time as business creations have fallen, resulting in net reductions in the number of VAT- or PAYE-registered businesses operating in the UK over the past six quarters.
The statistics are taken from the government’s Inter-Departmental Business Register, a database of approximately 2.8m businesses registered for either PAYE or VAT, just over half of the estimated 5.5m businesses operating in the UK (according to the Department of Business & Trade). The difference principally relates to sole traders with turnover below the VAT threshold who have not voluntarily registered for VAT, or for PAYE if they trade through a company. There is also a time lag on reporting the closure of businesses where a business continues to be registered, with the ONS waiting for several periods of zero VAT or zero payrolls before recording a business as closed.
The statistics are labelled as experimental because they are not as rigorous as annual statistics, but the advantage is that they provide data on business births and deaths in 2022, for which we will not get a full set of annual numbers until towards the end of this year.
As our chart illustrates, the quarterly net change in businesses in 2017 was +18,390, -15,460, +3,825 and +6,320 respectively, followed by +1,520, +15,165, +13,750, +4,365 in 2018, +19,120 and +4,265, +10,530 and +9,980 in 2019. The pandemic saw a fall in business closures as government support enabled businesses that would otherwise have stopped operating to stay alive, with a net decrease of -6,750 in Q1 2020 followed by net increases of +750, +16,170, +3,115 in the second, third and fourth quarters of 2020.
A spurt in business creations in early 2021 saw net increases of +15,245 and +2,885 in the first two quarters, before net decreases of -2,070 and 7,170 in the last two quarters of 2021. With pandemic support measures coming to an end and the onset of the energy crisis, the trend moved further into negative territory with quarterly net closures of -11,785, -5,930, -11,915 and -12,945 in 2022.
Quarterly business deaths averaged around 81,400 in 2017, 76,300 in 2018, 78,000 in 2019, 77,200 in 2020, 86,300 in 2021 and 91,800 in 2022, while quarterly business births averaged around 84,700 in 2017, 85,000 in 2018, 88,900 in 2019, 80,500 in 2020, 88,600 in 2021 and 81,200 in 2022.
These numbers will not be pretty reading for Kemi Badenoch, the new Secretary of State for Business and Trade. With interest rates on the rise, energy costs still at very high levels and consumers cutting back on spending, the risks are that many more existing businesses will cease trading, while business creations may continue to be subdued.
One crumb of comfort is that businesses founded during downturns are believed to do better than those founded in good times. So, if you are thinking of striking out on your own with a new business idea, there may be no better time than now.
The #icaewchartoftheweek is on the 5.9m UK businesses reported by the Department for Business, Energy & Industrial Strategy (BEIS) to have been in operation at 1 January 2019, generating a total of £4.1tn in revenue each year.
According to the annual statistics published a couple of weeks ago, there are 4.5m businesses with no employees, generating an average revenue of £63k for the 4.8m person involved (this includes partnerships). This contrasts with the 1.4m businesses with employees with 22.7m people engaged at an average revenue of £170k per person.
Unsurprisingly, the 3.2m sole traders, freelancers, partnerships and personal companies not registered for VAT or PAYE (a total of 3.5m people engaged, generating an average revenue of £34k per person) have much lower average revenues than the 1.2m that are (1.3m, generating an average of £141k). Most part-time freelancers and self-employed contractors included in the former will have no need to register for VAT, while the latter will include VAT-registered consultants and other highly-paid individuals that are self-employed or employed via their own companies.
Most of the 1.4m employers are small businesses (up to 99 staff), employing 9.9m people with an average revenue of £149k per person (not shown in the chart). These include 141,135 businesses with only 1 employee (0.3m people generating an average of £83k), 751,205 businesses with 2-4 employees (2.1m, £158k), 399,365 with 5-19 employees (3.7m, £136k) and 96,505 businesses with 20-99 employees (3.8m, £162k).
There are 12,055 medium sized businesses with 100-249 employees (1.9m people in total, generating an average of £205k), while 7,685 large businesses employed 10.9m people at an average revenue of £182k per person.
There are some important caveats. Firstly, the numbers employed may include some double counting, as people can be involved in more than one business in different capacities. In addition, it is important to note that revenue is not the same as profit, and the numbers do not analyse the cost-structure of different sizes of business.