2 April 2020: ICAEW has called the delay to the UK Government’s 2020 Spending Review a ‘sensible move’ in the current climate, but warned that any further delays pose a major risk to infrastructure projects and economic recovery.
The 2020 Spending Review, scheduled to be completed by July this year, has been delayed to enable the government to remain focused on responding to the ongoing coronavirus outbreak. It is likely that the 2020 Spending Review will now be moved to November to coincide with the Autumn Budget, adding a further delay of at least four months to the process.
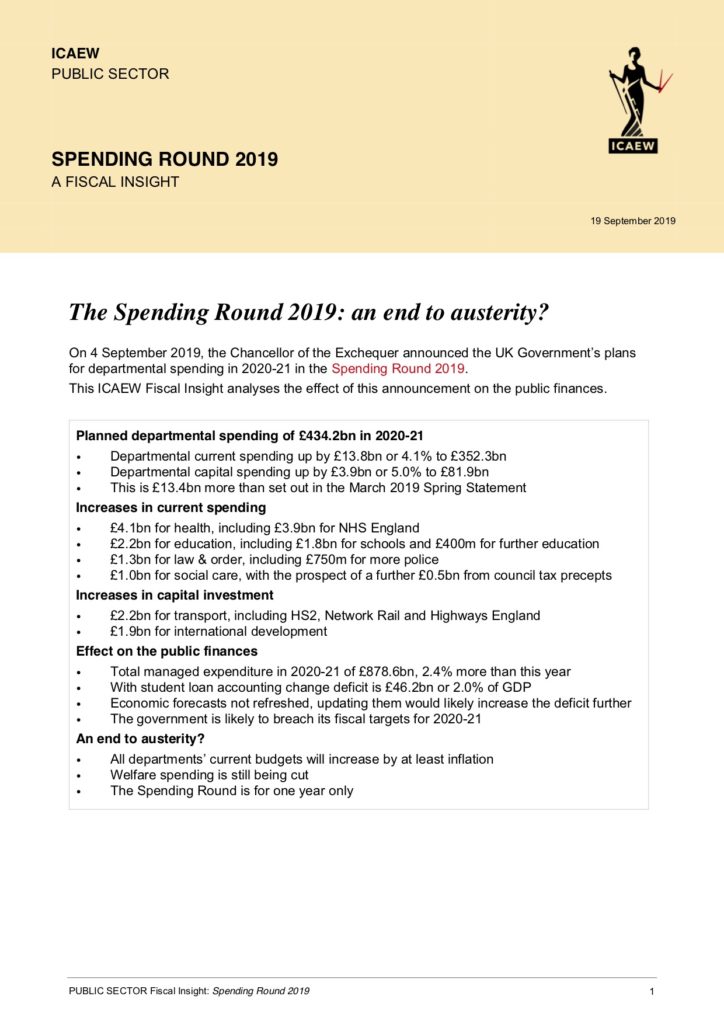
The last three-year Spending Review was in 2015, covering the financial years 2016-17, 2017-18 and 2018-19. The anticipated 2018 Spending Review never took place and departmental budgets were instead ‘rolled over’ into 2019-20, while the Spending Review in 2019 was also cancelled and replaced by an interim Spending Round that set out current spending by departments for one financial year (2020-21) and capital investment plans for two financial years (2020-21 and 2021-22).
Based on the overall spending envelope set out in the Spring Budget 2020, the Spending Review this year is expected to set out detailed financial budgets for each government department for a three-year period (from 2021-22 to 2023-24) and four years for capital investment (to 2024-25), enabling public bodies to plan ahead and get the best value for money for the taxpayer.
Alison Ring, Director, Public Sector for ICAEW said: “The latest delay is completely understandable given the huge ramifications for the economy and the public finances of the coronavirus emergency. It makes sense for the Chancellor and the Treasury to redeploy resources to deal with the coronavirus now and to re-evaluate spending plans later when there is a clearer view on the financial impact.
One concern is the risk this further delay poses to infrastructure projects, given how important they will be to a successful economic recovery. The need to plan and design infrastructure well in advance means that delays in authorising funding could have a significant knock-on effect to when projects are eventually delivered, and to the boost they can give to the economy.
The Chancellor should give some thought to providing assurances to departments about capital funding in 2021-22 and 2022-23 so that they have sufficient certainty to green-light projects sooner rather than later.
The Chancellor should also consider the Government’s approach to Spending Reviews. There are many arguments in favour of holding five-year Spending Reviews every three years, rather than three-year Spending Reviews every five years.”
For more information: