ICAEW chart of the week: Business growth

Our chart this week asks whether the recent low rate of growth in numbers of businesses registered for PAYE and VAT is linked to the increasing difficulty of doing business in the UK.

ICAEW chart of the week on business growth, showing the net change in the number of PAYE and VAT registered businesses by year. 

2017: +13,400 
2018: +35,300 
2019: +44,300 
2020: +13,700 
2021: +9,400 
2022: -48,000 
2023: -26,300 
2024: +12,100 
H1 2025: +10,000 

5 Sep 2025. Chart by Martin Wheatcroft FCA. Source: ONS, 'Business demography: Q2 (Apr to Jun) 2025.

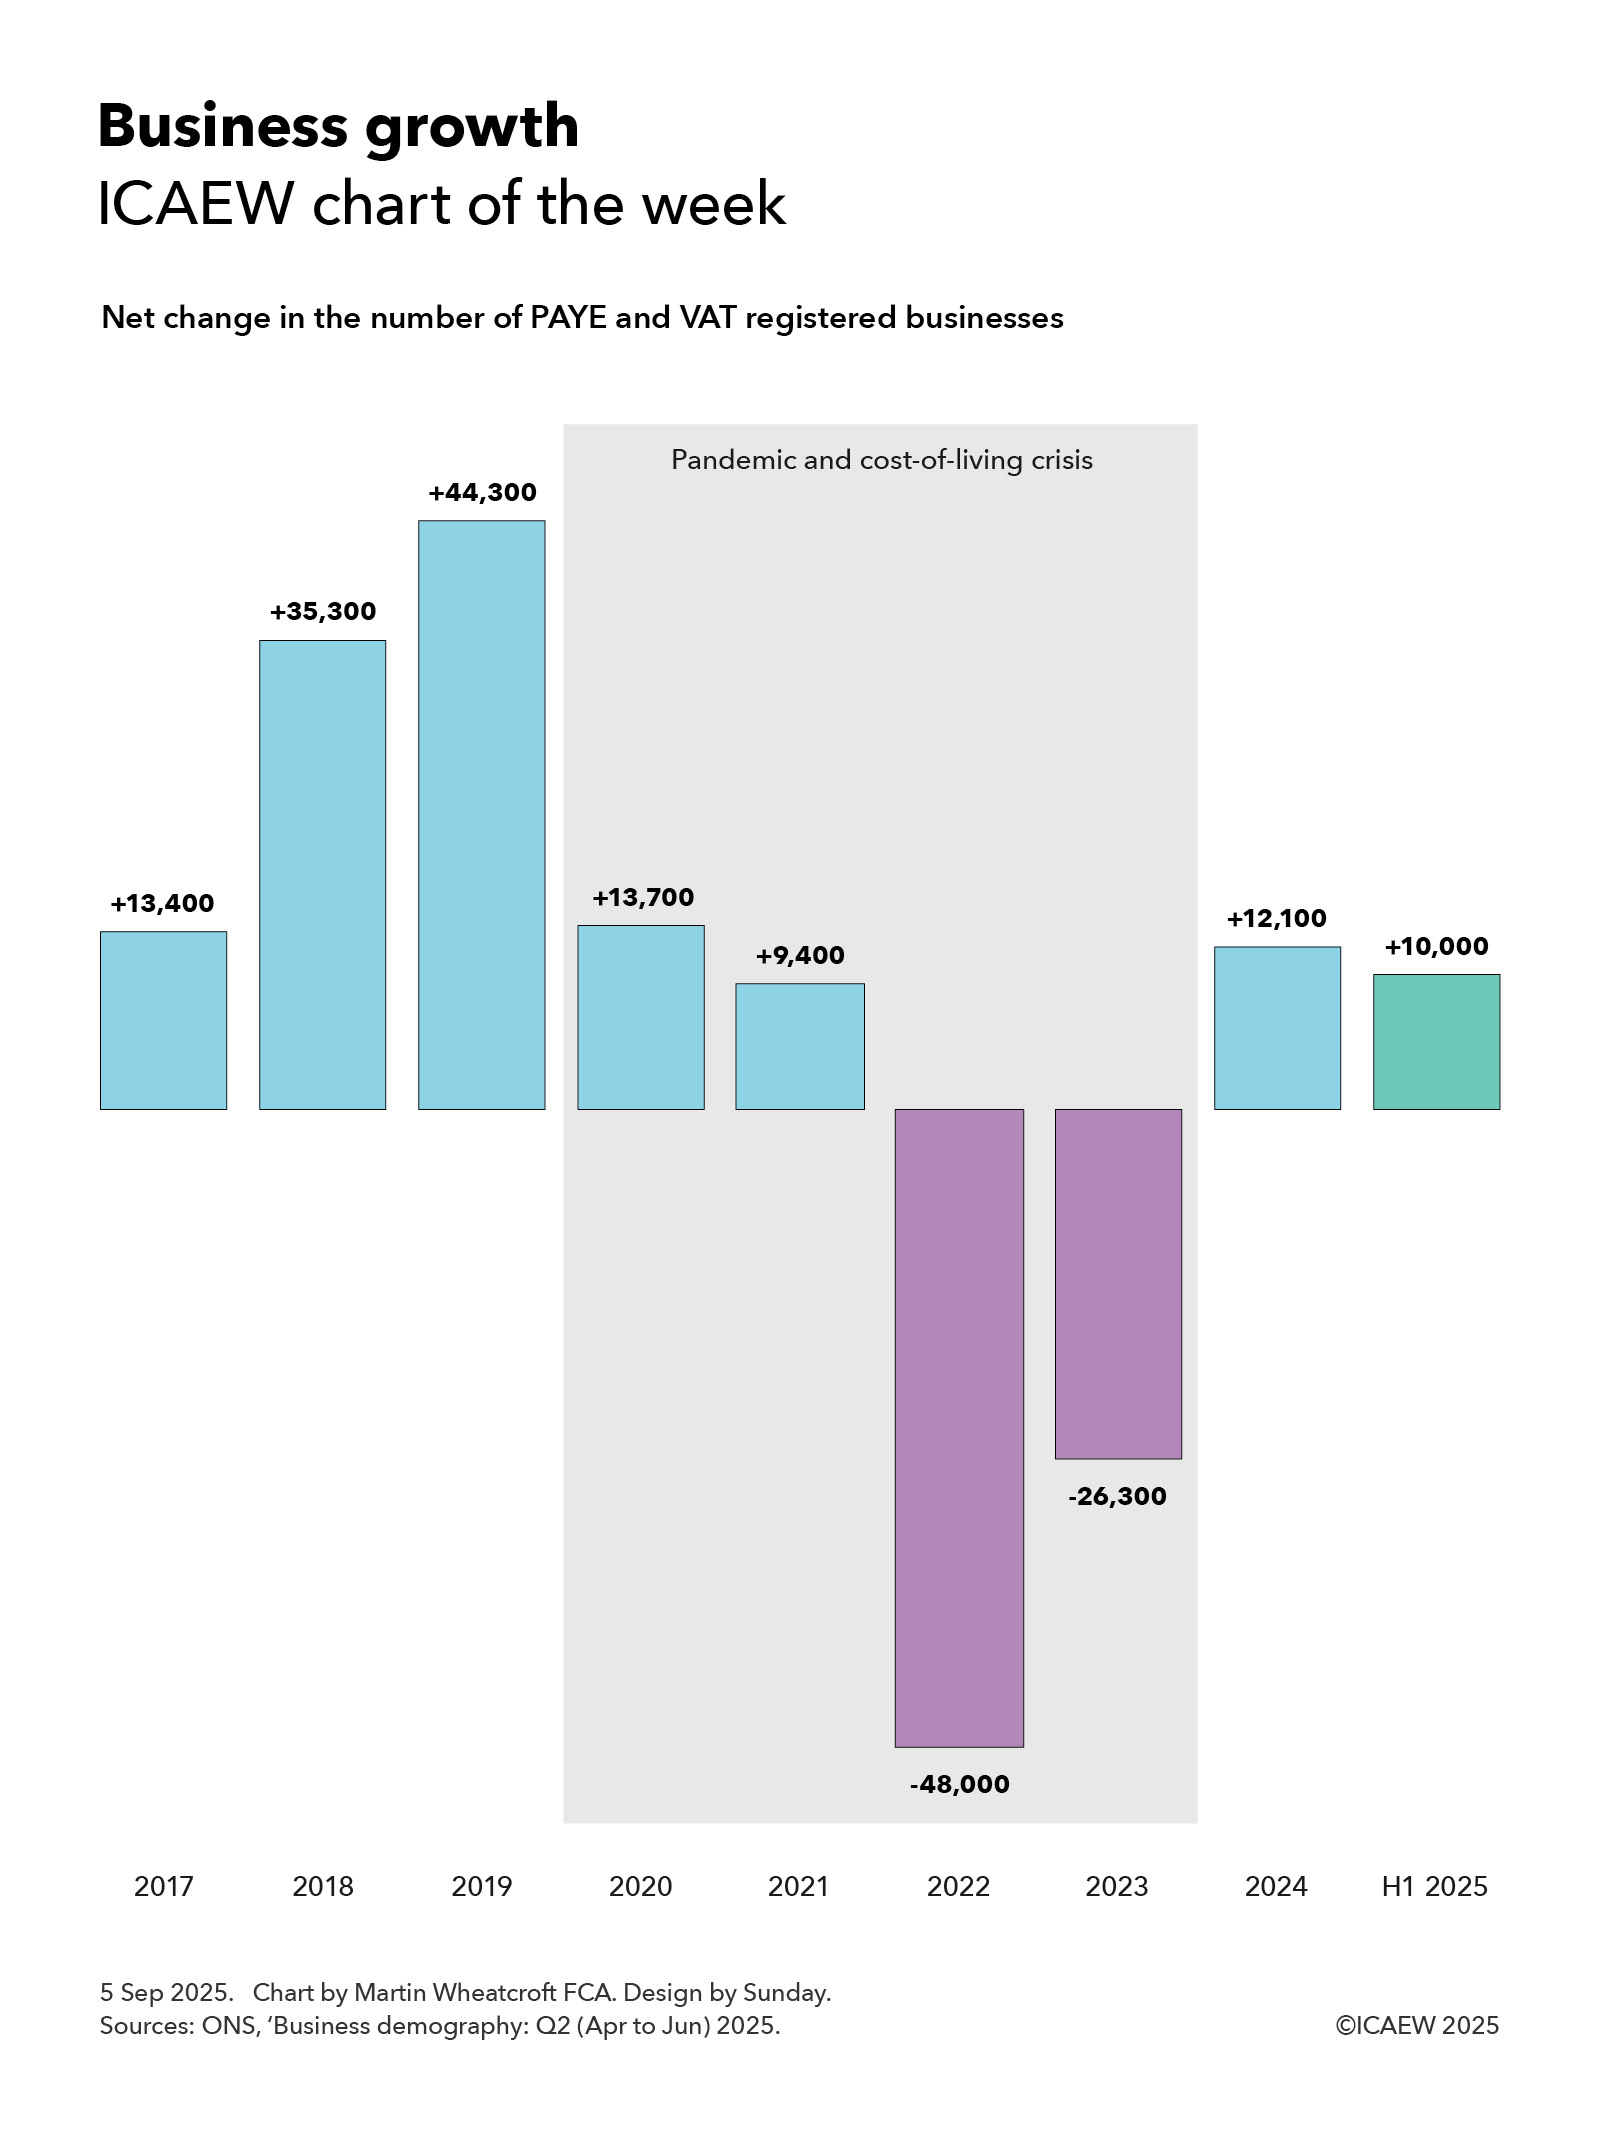
According to the Office for National Statistics, there were net additions of approximately 13,400, 35,300 and 44,300 to the UK inter-departmental business register in 2017, 2018 and 2019 respectively. This was followed by net additions of 13,700 and 9,400 in 2020 and 2021 during the pandemic and then net reductions of 48,000 and 26,300 in 2022 and 2023 during the cost-of-living crisis.

The register started growing again in 2024 with net additions of 12,100, followed by a net increase of approximately 10,000 in the first half of 2025. This rate of increase is significantly lower than the average rate of net business formation before the pandemic but is a significant improvement over the net contraction in the number of businesses in 2022 and 2023 during the cost-of-living crisis.

The net changes are equivalent to 0.5%, 1.3%, 1.6%, 0.5%, 0.3%, -1.7%, -1.0% and 0.4% in the total number of registered businesses in 2017 to 2024 respectively and annualised growth of 0.7% in the first half of 2025.

The total number of PAYE and VAT registered businesses is projected to have reached around 2.75m in June 2025, based on the last published count for March 2024 plus reported movements since then. This is out of an overall total of somewhere in the region of 5.5m businesses in the UK, with the difference mainly due to single-person companies and sole traders that do not employ any staff and operate below the VAT threshold of £90,000 per year.

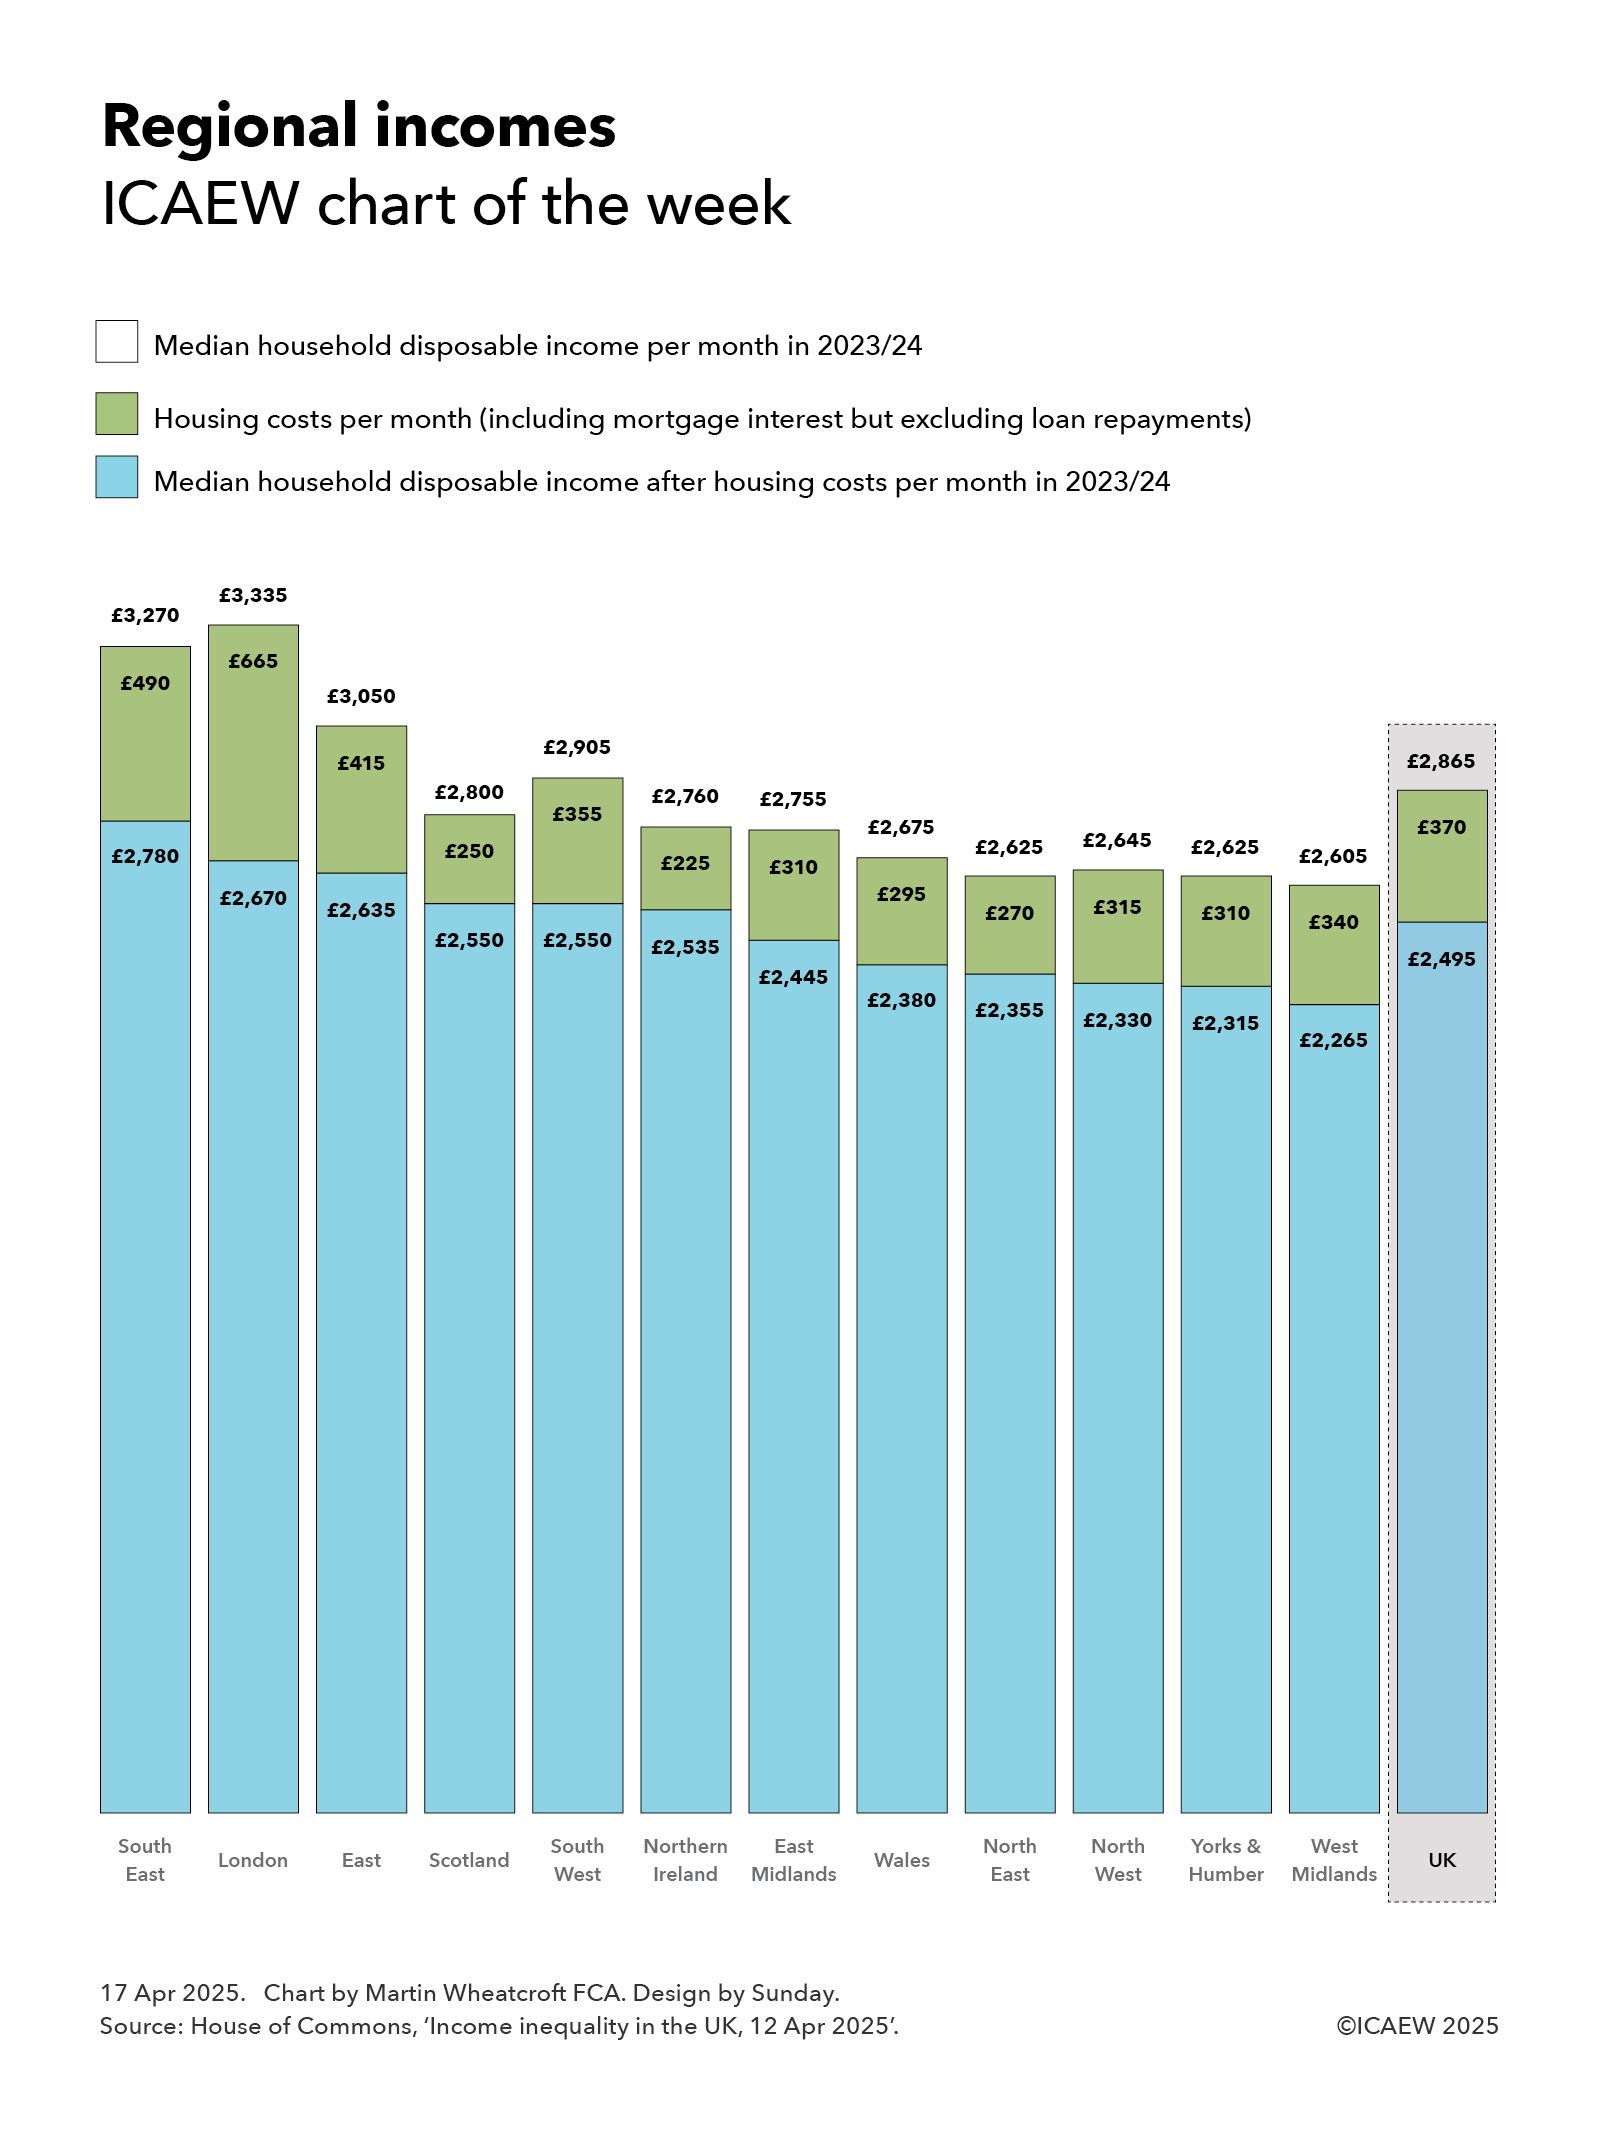
The approximately 2.75m registered businesses can be analysed into just under 2.1m companies and other types of corporations, approximately 400,000 sole proprietors, 150,000 or so partnerships, and around 100,000 non-profit bodies, mutual associations and public sector organisations. Approximately 945,000 registered businesses are in London and the South East, 675,000 are in the Midlands and the East of England, 535,000 in the North of England, 340,000 in the South West of England and Wales, 175,000 in Scotland, and 80,000 in Northern Ireland.

Business births between 2017 and 2024 were approximately: 338,700; 341,100; 355,700; 322,000; 354,300; 327,500; 307,100; and 310,100; there were 167,600 in the first half of 2025. Business deaths in 2017 to 2024 were: 325,300; 304,800; 311,400; 308,300; 344,900; 375,500; 333,400; and 298,000; with 157,600 in the first half of 2025.

The overall change in the total number of registered businesses between 2017 and the first half of 2025 was 63,900, an average of 7,500 or 0.3% a year over eight and a half years, comprising an annual average of 332,100 business births less 324,600 business deaths in that time.

The chart highlights both the very difficult economic times we have been through in the past few years with the pandemic and cost-of-living crisis and the current period of weak economic growth that has yet to return to pre-pandemic levels.

One of the key ways that we can increase the rate of net business formation is to make it easier to do business in the UK, as discussed in ICAEW’s growth campaign. This asks why it is too difficult, too expensive and too uncertain to do business in the UK today and suggests ways the government can streamline regulation, reduce costs and unnecessary frictions, and provide businesses with greater confidence to invest and grow.

This chart was originally published by ICAEW.

ICAEW chart of the week: Regional incomes

Our chart this week looks at how median household disposable income varies across the UK, with the South East region topping the rankings and the West Midlands region at the bottom.

A column chart showing median household disposable income in 2023/24 before and after housing costs by region. 

South East: £3,270 median household disposable income per month in 2023/24 - £490 housing costs per month (including mortgage interest but excluding loan repayments) = £2,780 median household disposable income after housing costs per month in 2023/24.  
London £3,335 - £665 = £2,670. 
East £3,050 - £415 = £2,635. 
Scotland £2,800 - £250 = £2,550. 
South West £2,905 - £355 = £2,550.  
Northern Ireland £2,760 - £225 = £2,535. 
East Midlands £2,755 - £310 = £2,445. 
Wales £2,675 - £295 = £2,380. 
North East £2,625 - £270 = £2,380. 
North West £2,645 - £315 = £2,330. 
Yorks & Humber  £2,625 - £310 = £2,315. 
West Midlands £2,605 - £340 = £2,265. 
 
UK £2,865 - £370 = £2,495. 

17 Apr 2025. Chart by Martin Wheatcroft FCA. Design by Sunday. Source: House of Commons, 'Income inequality in the UK, 12 Apr 2025'.

Our chart this week is adapted from one of the charts in a House of Commons research report on income inequality in the UKpublished on 12 April 2025, showing how median household disposable incomes before and after housing costs vary significantly between the regions and nations of the UK.

As the chart illustrates, median household disposable income in the South East of England during 2023/24 was the highest in the UK at £2,780 per month, reflecting a median disposable income of £3,270 per month, before housing costs of £490 per month. 

London had a higher median disposable income at £3,335 per month, but also much higher housing costs at £665 per month, resulting in a lower median disposable income after housing costs of £2,670 per month.

This is followed by the East of England, with median disposable income after housing costs in 2023/24 of £2,635 per month (£3,050-£415), Scotland £2,550 (£2,800-£250); South West £2,550 (£2,905-£355); Northern Ireland £2,535 (£2,760-£225); East Midlands £2,445 (£2,755-£310), Wales £2,380 (£2,675-£295); North East £2,335 (£2,625-£270); North West £2,330 (£2,645-£315); Yorkshire and the Humber £2,315 (£2,625-£310); and West Midlands £2,265 (£2,605-£340).

Median household disposable income after housing costs in the West Midlands is 19% less than in the South East of England. West Midlands in this case includes Herefordshire, Shropshire, Staffordshire, Warwickshire and Worcestershire, in addition to the West Midlands ‘city-region’ that is centred on Birmingham.

The median household disposable income after housing costs for the UK is £2,495 per month (£2,865-£370) or £574 per week (£659-£85). 

The chart doesn’t show the median for England, which is also £2,495 per month but reflects a higher median disposable income and higher housing costs (£2,885-£390).

For this purpose, household disposable income is equal to income from employment and investments plus cash benefits (state pension, universal credit and other welfare benefits) net of income tax, national insurance, council tax (domestic rates in Northern Ireland), pension contributions, and student loan repayments, among other items. It is not net of VAT or other indirect taxes that households also pay.

Household disposable income is not the same as discretionary or surplus income, as it is before deducting other costs that families need to incur, such as food, energy, clothing, internet and childcare provision to name just a few examples. 

Housing costs include rents (gross of housing benefit), water bills, mortgage interest payments, structural insurance premiums, ground rent and service charges. They exclude the repayment element of mortgage payments, meaning that disposable income after housing costs on a cash basis can be substantially lower than is suggested by the chart.

In addition, as the median household for disposable income before housing costs is different to the median household for disposable income after housing costs, the housing cost numbers in the chart are affected by the much lower costs incurred by most pensioner households, the majority of which have paid off their mortgages and so live rent-free.

Disposable incomes vary widely between households with the bottom and top 10% of households in the UK having a monthly disposable income before housing costs in 2023/24 of less than £1,300 per month or more than £5,475 per month respectively. 

Disposable income also varies between household types, with (for example) a UK median household disposable income before housing costs in 2023/24 of £4,320 per month for a couple with two children under the age of 14, £3,385 per month for a single person with two children under the age of 14, £2,825 per month for a couple with no children, and £1,890 per month for a single person with no children. 

While the variations between households means there are some very well-off households as well as very poor ones in each region, the median numbers do tell us a lot about the relative prosperity of each region, with London and the South East being significantly more prosperous compared with Wales, the three Northern regions of England, and the West Midlands.

This chart was originally published by ICAEW.

ICAEW chart of the week: Public finances by region 2020/21

The ICAEW chart this week highlights how every single region and nation in the UK was in deficit in the first fiscal year of the pandemic.

Our chart this week highlights how every single region and nation in the UK was in deficit in the first fiscal year of the pandemic.

The Office for National Statistics (ONS) recently released an analysis of government revenue and expenditure by region and nation of the UK for the financial year ended 31 March 2021 – the first year of the pandemic. 

This was a year that saw public spending balloon to £1,112bn from £884bn in 2019/20 as the government splurged cash in response to the arrival of the coronavirus. At the same time, taxes and other income fell to £794bn in 2020/21 from £829bn the year before, while unprecedented levels of support to businesses and individuals prevented a much greater collapse in tax receipts. The resulting deficit of £318bn was the largest ever in peacetime.

The chart illustrates how every region incurred a deficit in 2020/21, with a deficit per head of approximately £800 in Greater London (revenue per head £18,440/expenditure per head £19,240), followed by £1,640 in the South East (£14,020/£15,660), £3,360 in the East of England (£11,940/£15,300), £5,000 in the South West (£10,940/£15,940), £5,140 in the East Midlands (£9,860/£15,000), £5,920 in Yorkshire and The Humber (£9,620/£15,540), £6,220 in the West Midlands Region (£9,380/£15,600), £6,580 in Scotland (£11,780/£18,360), £6,780 in the North West (£9,800/£16,580), £7,960 in the North East (£8,700/£16,660), £8,180 in Wales (£9,060/£17,240) and £9,500 in Northern Ireland (£8,740/£18,240). These numbers compare with an overall UK average deficit of approximately £4,740 per person, comprising per capita revenue of £11,840 less per capita spending of £16,580 based on a population of 67.1m.

The deficit in 2020/21 was so large that even London and the South East, which normally supply substantially more revenue to the government than they receive back in expenditure, saw the reverse this time. (In contrast, for example, with the surpluses of £4,520 and £2,180 per head respectively in 2019/20.)

Inclusive of pandemic spending, most regions ended up benefiting from government expenditure and welfare support of between £15,000 and £17,000 per person in the year, the outliers being Scotland and Northern Ireland, where spending exceeded £18,000 and London where it exceeded £19,000 per head. There is much wider range in the average for taxes and other income, from less than £9,000 per person in in the North East and Northern Ireland (more than 25% lower than the UK-wide average) up to more than £14,000 per head in the South East and more than £18,000 per head in London (more than 50% higher than the UK average).

For the public finances 2020/21 was a landmark year, in which exceptional levels of expenditure and an extraordinarily large deficit led to a significant increase in public debt. Despite that – as our chart illustrates – there continue to be significant economic and fiscal disparities across the regions and nations of the UK.

This chart was originally published by ICAEW.