ICAEW chart of the week: Regional incomes

Our chart this week looks at how median household disposable income varies across the UK, with the South East region topping the rankings and the West Midlands region at the bottom.

A column chart showing median household disposable income in 2023/24 before and after housing costs by region. 

South East: £3,270 median household disposable income per month in 2023/24 - £490 housing costs per month (including mortgage interest but excluding loan repayments) = £2,780 median household disposable income after housing costs per month in 2023/24.  
London £3,335 - £665 = £2,670. 
East £3,050 - £415 = £2,635. 
Scotland £2,800 - £250 = £2,550. 
South West £2,905 - £355 = £2,550.  
Northern Ireland £2,760 - £225 = £2,535. 
East Midlands £2,755 - £310 = £2,445. 
Wales £2,675 - £295 = £2,380. 
North East £2,625 - £270 = £2,380. 
North West £2,645 - £315 = £2,330. 
Yorks & Humber  £2,625 - £310 = £2,315. 
West Midlands £2,605 - £340 = £2,265. 
 
UK £2,865 - £370 = £2,495. 

17 Apr 2025. Chart by Martin Wheatcroft FCA. Design by Sunday. Source: House of Commons, 'Income inequality in the UK, 12 Apr 2025'.

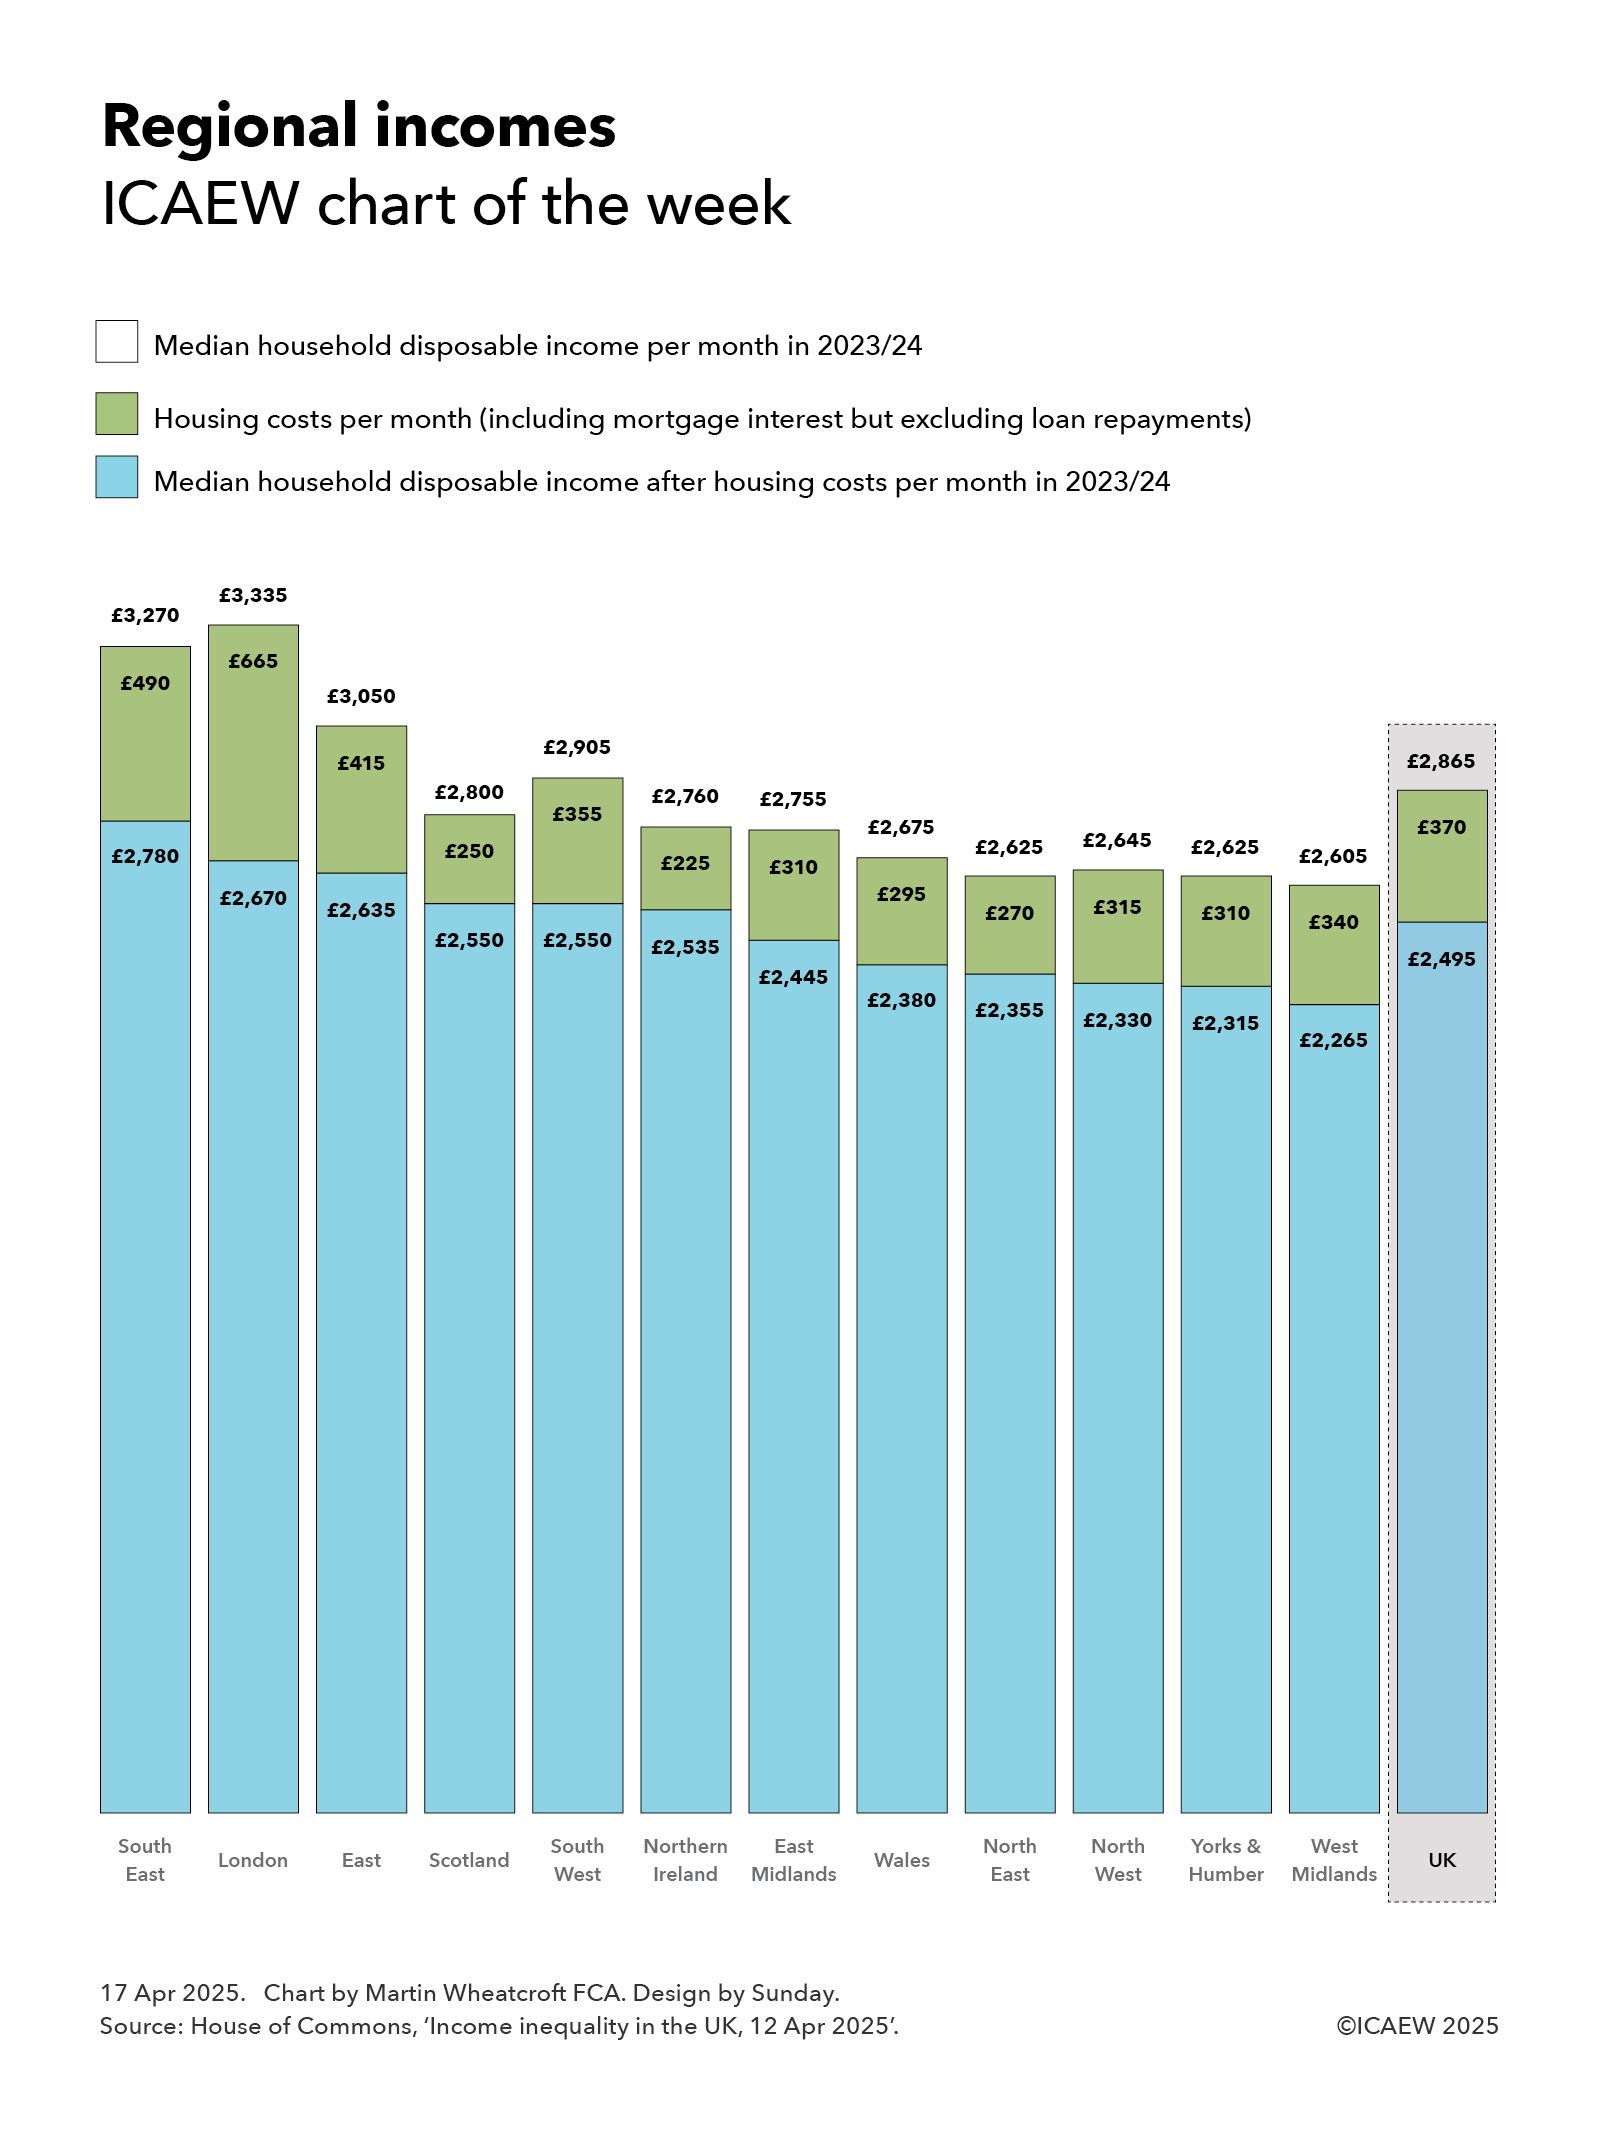
Our chart this week is adapted from one of the charts in a House of Commons research report on income inequality in the UKpublished on 12 April 2025, showing how median household disposable incomes before and after housing costs vary significantly between the regions and nations of the UK.

As the chart illustrates, median household disposable income in the South East of England during 2023/24 was the highest in the UK at £2,780 per month, reflecting a median disposable income of £3,270 per month, before housing costs of £490 per month. 

London had a higher median disposable income at £3,335 per month, but also much higher housing costs at £665 per month, resulting in a lower median disposable income after housing costs of £2,670 per month.

This is followed by the East of England, with median disposable income after housing costs in 2023/24 of £2,635 per month (£3,050-£415), Scotland £2,550 (£2,800-£250); South West £2,550 (£2,905-£355); Northern Ireland £2,535 (£2,760-£225); East Midlands £2,445 (£2,755-£310), Wales £2,380 (£2,675-£295); North East £2,335 (£2,625-£270); North West £2,330 (£2,645-£315); Yorkshire and the Humber £2,315 (£2,625-£310); and West Midlands £2,265 (£2,605-£340).

Median household disposable income after housing costs in the West Midlands is 19% less than in the South East of England. West Midlands in this case includes Herefordshire, Shropshire, Staffordshire, Warwickshire and Worcestershire, in addition to the West Midlands ‘city-region’ that is centred on Birmingham.

The median household disposable income after housing costs for the UK is £2,495 per month (£2,865-£370) or £574 per week (£659-£85). 

The chart doesn’t show the median for England, which is also £2,495 per month but reflects a higher median disposable income and higher housing costs (£2,885-£390).

For this purpose, household disposable income is equal to income from employment and investments plus cash benefits (state pension, universal credit and other welfare benefits) net of income tax, national insurance, council tax (domestic rates in Northern Ireland), pension contributions, and student loan repayments, among other items. It is not net of VAT or other indirect taxes that households also pay.

Household disposable income is not the same as discretionary or surplus income, as it is before deducting other costs that families need to incur, such as food, energy, clothing, internet and childcare provision to name just a few examples. 

Housing costs include rents (gross of housing benefit), water bills, mortgage interest payments, structural insurance premiums, ground rent and service charges. They exclude the repayment element of mortgage payments, meaning that disposable income after housing costs on a cash basis can be substantially lower than is suggested by the chart.

In addition, as the median household for disposable income before housing costs is different to the median household for disposable income after housing costs, the housing cost numbers in the chart are affected by the much lower costs incurred by most pensioner households, the majority of which have paid off their mortgages and so live rent-free.

Disposable incomes vary widely between households with the bottom and top 10% of households in the UK having a monthly disposable income before housing costs in 2023/24 of less than £1,300 per month or more than £5,475 per month respectively. 

Disposable income also varies between household types, with (for example) a UK median household disposable income before housing costs in 2023/24 of £4,320 per month for a couple with two children under the age of 14, £3,385 per month for a single person with two children under the age of 14, £2,825 per month for a couple with no children, and £1,890 per month for a single person with no children. 

While the variations between households means there are some very well-off households as well as very poor ones in each region, the median numbers do tell us a lot about the relative prosperity of each region, with London and the South East being significantly more prosperous compared with Wales, the three Northern regions of England, and the West Midlands.

This chart was originally published by ICAEW.

ICAEW chart of the week: England and Wales Census 2021

The ICAEW chart of the week looks at the results of last year’s census, illustrating how the population of southern and central England has grown much faster than in the north of England and in Wales over the past decade.

Bubble chart overlayed on a map of England & Wales scaled to population in each region with inner bubbles showing the increase in the last decade. 

North East 2.6m (+1.9%)
North West 7.4m (+5.2%)
Yorkshire 5.5m (+3.7%)

West Midlands 6.0m (+6.2%)
East Midlands 4.9m (+7.7%)
East of England 6.3m (+8.3%)

South West 5.7m (+7.8%)
South East 9.3m (+7.5%)
London 8.8m (+7.7%)

Wales 3.1m (+1.4%)

The Office for National Statistics (ONS) released the first results from Census 2021 in England and Wales on Tuesday 28 June, providing an initial snapshot of who we are and where we live across two of the four nations of the UK. It follows on from the initial release earlier this year of the Northern Ireland Census 2021, but we won’t see a full picture for the UK for some time as the 2022 census in Scotland was delayed until this year.

The chart highlights how the East of England was the fastest growing region in England, with its population growing by 8.3% to 6.3m between 2011 and 2021. This was followed by the South West (up 7.8% to 5.7m), London (up 7.7% to 8.8m), East Midlands (up 7.7% to 4.9m) and the South East (up 7.5% to 9.3m). The West Midlands grew less quickly (up 6.2% to 6.0m), but still by more than the North West (up 5.2% to 7.4m), Yorkshire (up 3.7% to 5.5m) and the North East (up 1.9% to 2.6m). The population of Wales only increased by 1.4% over 10 years to remain at 3.1m.

In total the population of England and Wales amounted to 59.6m in 2021. This was 6.3% higher than the 56.1m people living in the UK in 2011 and 14.6% higher than the 52.0m reported by the 2001 census. This reflects a slowing rate of growth in the last decade at 0.6% a year on average compared with the average rate of 0.8% seen between 2001 and 2011 and is substantially lower than the compound growth of 1.6% a year experienced over 120 years since the first official census in 1801 reported a population of 8.9m in England & Wales.

The ONS has published a breakdown of the population by age and sex by local authority, highlighting how the number of people has changed significantly in some parts of the country, such as Tower Hamlets (up 22% in 10 years), Dartford (up 20%), Barking and Dagenham (up 18%), Bedford (up 18%), Peterborough (up 17.5%), Central Bedfordshire and Tewkesbury (each up 16%) and Salford, Milton Keynes, Uttlesford, Vale of White Horse and Wokingham (each up by around 15%). The biggest falls were in Kensington and Chelsea (down 10%) and Westminster (down 7%), although there is some speculation that this was because of the pandemic as family and second homes elsewhere proved to be more attractive places to work from home during lockdown. This is unlikely to be the driver of decreases in some rural areas such as the 6% fall in Ceredigion in Wales or the 5% fall in Copeland in Cumbria, where long-term trends of population decline have continued.

The census has also confirmed how we are getting older on average, with a 20% increase in those aged 65 and over from 9.2m in 2011 to 11.1m in 2021. This continues to be a big driver for public finances, as more funding is needed to pay for pensions, health and social care at the expense of other public services.

There is still a lot of data crunching to do as the statisticians work through the more in-depth questions on the census, ranging from employment status, education and housing to ethnicity, religion, sexual orientation and gender identity among other characteristics – demographics in action and the likely source of future charts of the week.

This chart was originally published by ICAEW.

ICAEW chart of the week: Public finances by region 2020/21

The ICAEW chart this week highlights how every single region and nation in the UK was in deficit in the first fiscal year of the pandemic.

Our chart this week highlights how every single region and nation in the UK was in deficit in the first fiscal year of the pandemic.

The Office for National Statistics (ONS) recently released an analysis of government revenue and expenditure by region and nation of the UK for the financial year ended 31 March 2021 – the first year of the pandemic. 

This was a year that saw public spending balloon to £1,112bn from £884bn in 2019/20 as the government splurged cash in response to the arrival of the coronavirus. At the same time, taxes and other income fell to £794bn in 2020/21 from £829bn the year before, while unprecedented levels of support to businesses and individuals prevented a much greater collapse in tax receipts. The resulting deficit of £318bn was the largest ever in peacetime.

The chart illustrates how every region incurred a deficit in 2020/21, with a deficit per head of approximately £800 in Greater London (revenue per head £18,440/expenditure per head £19,240), followed by £1,640 in the South East (£14,020/£15,660), £3,360 in the East of England (£11,940/£15,300), £5,000 in the South West (£10,940/£15,940), £5,140 in the East Midlands (£9,860/£15,000), £5,920 in Yorkshire and The Humber (£9,620/£15,540), £6,220 in the West Midlands Region (£9,380/£15,600), £6,580 in Scotland (£11,780/£18,360), £6,780 in the North West (£9,800/£16,580), £7,960 in the North East (£8,700/£16,660), £8,180 in Wales (£9,060/£17,240) and £9,500 in Northern Ireland (£8,740/£18,240). These numbers compare with an overall UK average deficit of approximately £4,740 per person, comprising per capita revenue of £11,840 less per capita spending of £16,580 based on a population of 67.1m.

The deficit in 2020/21 was so large that even London and the South East, which normally supply substantially more revenue to the government than they receive back in expenditure, saw the reverse this time. (In contrast, for example, with the surpluses of £4,520 and £2,180 per head respectively in 2019/20.)

Inclusive of pandemic spending, most regions ended up benefiting from government expenditure and welfare support of between £15,000 and £17,000 per person in the year, the outliers being Scotland and Northern Ireland, where spending exceeded £18,000 and London where it exceeded £19,000 per head. There is much wider range in the average for taxes and other income, from less than £9,000 per person in in the North East and Northern Ireland (more than 25% lower than the UK-wide average) up to more than £14,000 per head in the South East and more than £18,000 per head in London (more than 50% higher than the UK average).

For the public finances 2020/21 was a landmark year, in which exceptional levels of expenditure and an extraordinarily large deficit led to a significant increase in public debt. Despite that – as our chart illustrates – there continue to be significant economic and fiscal disparities across the regions and nations of the UK.

This chart was originally published by ICAEW.