This week’s chart takes a look at UK inflation following news that the annual rate of inflation more than doubled in April to 1.5%, more than twice the 0.7% reported for the previous month.
The headline rate of inflation doubled this week from 0.7% to 1.5%, giving rise to concerns about the economic recovery. Economists aren’t getting worried just yet, but are they right to be so sanguine?
This scale of this jump partly reflects the timing of the first and current lockdowns, as inflation is typically measured by comparing prices with the same month a year previously, with significant changes both this year as the UK started to emerge from its third lockdown and a year ago as it was entering its first. Some commentators have pointed out that the temporary cut in VAT on restaurant food and leisure activities help prevent the jump from being even higher.
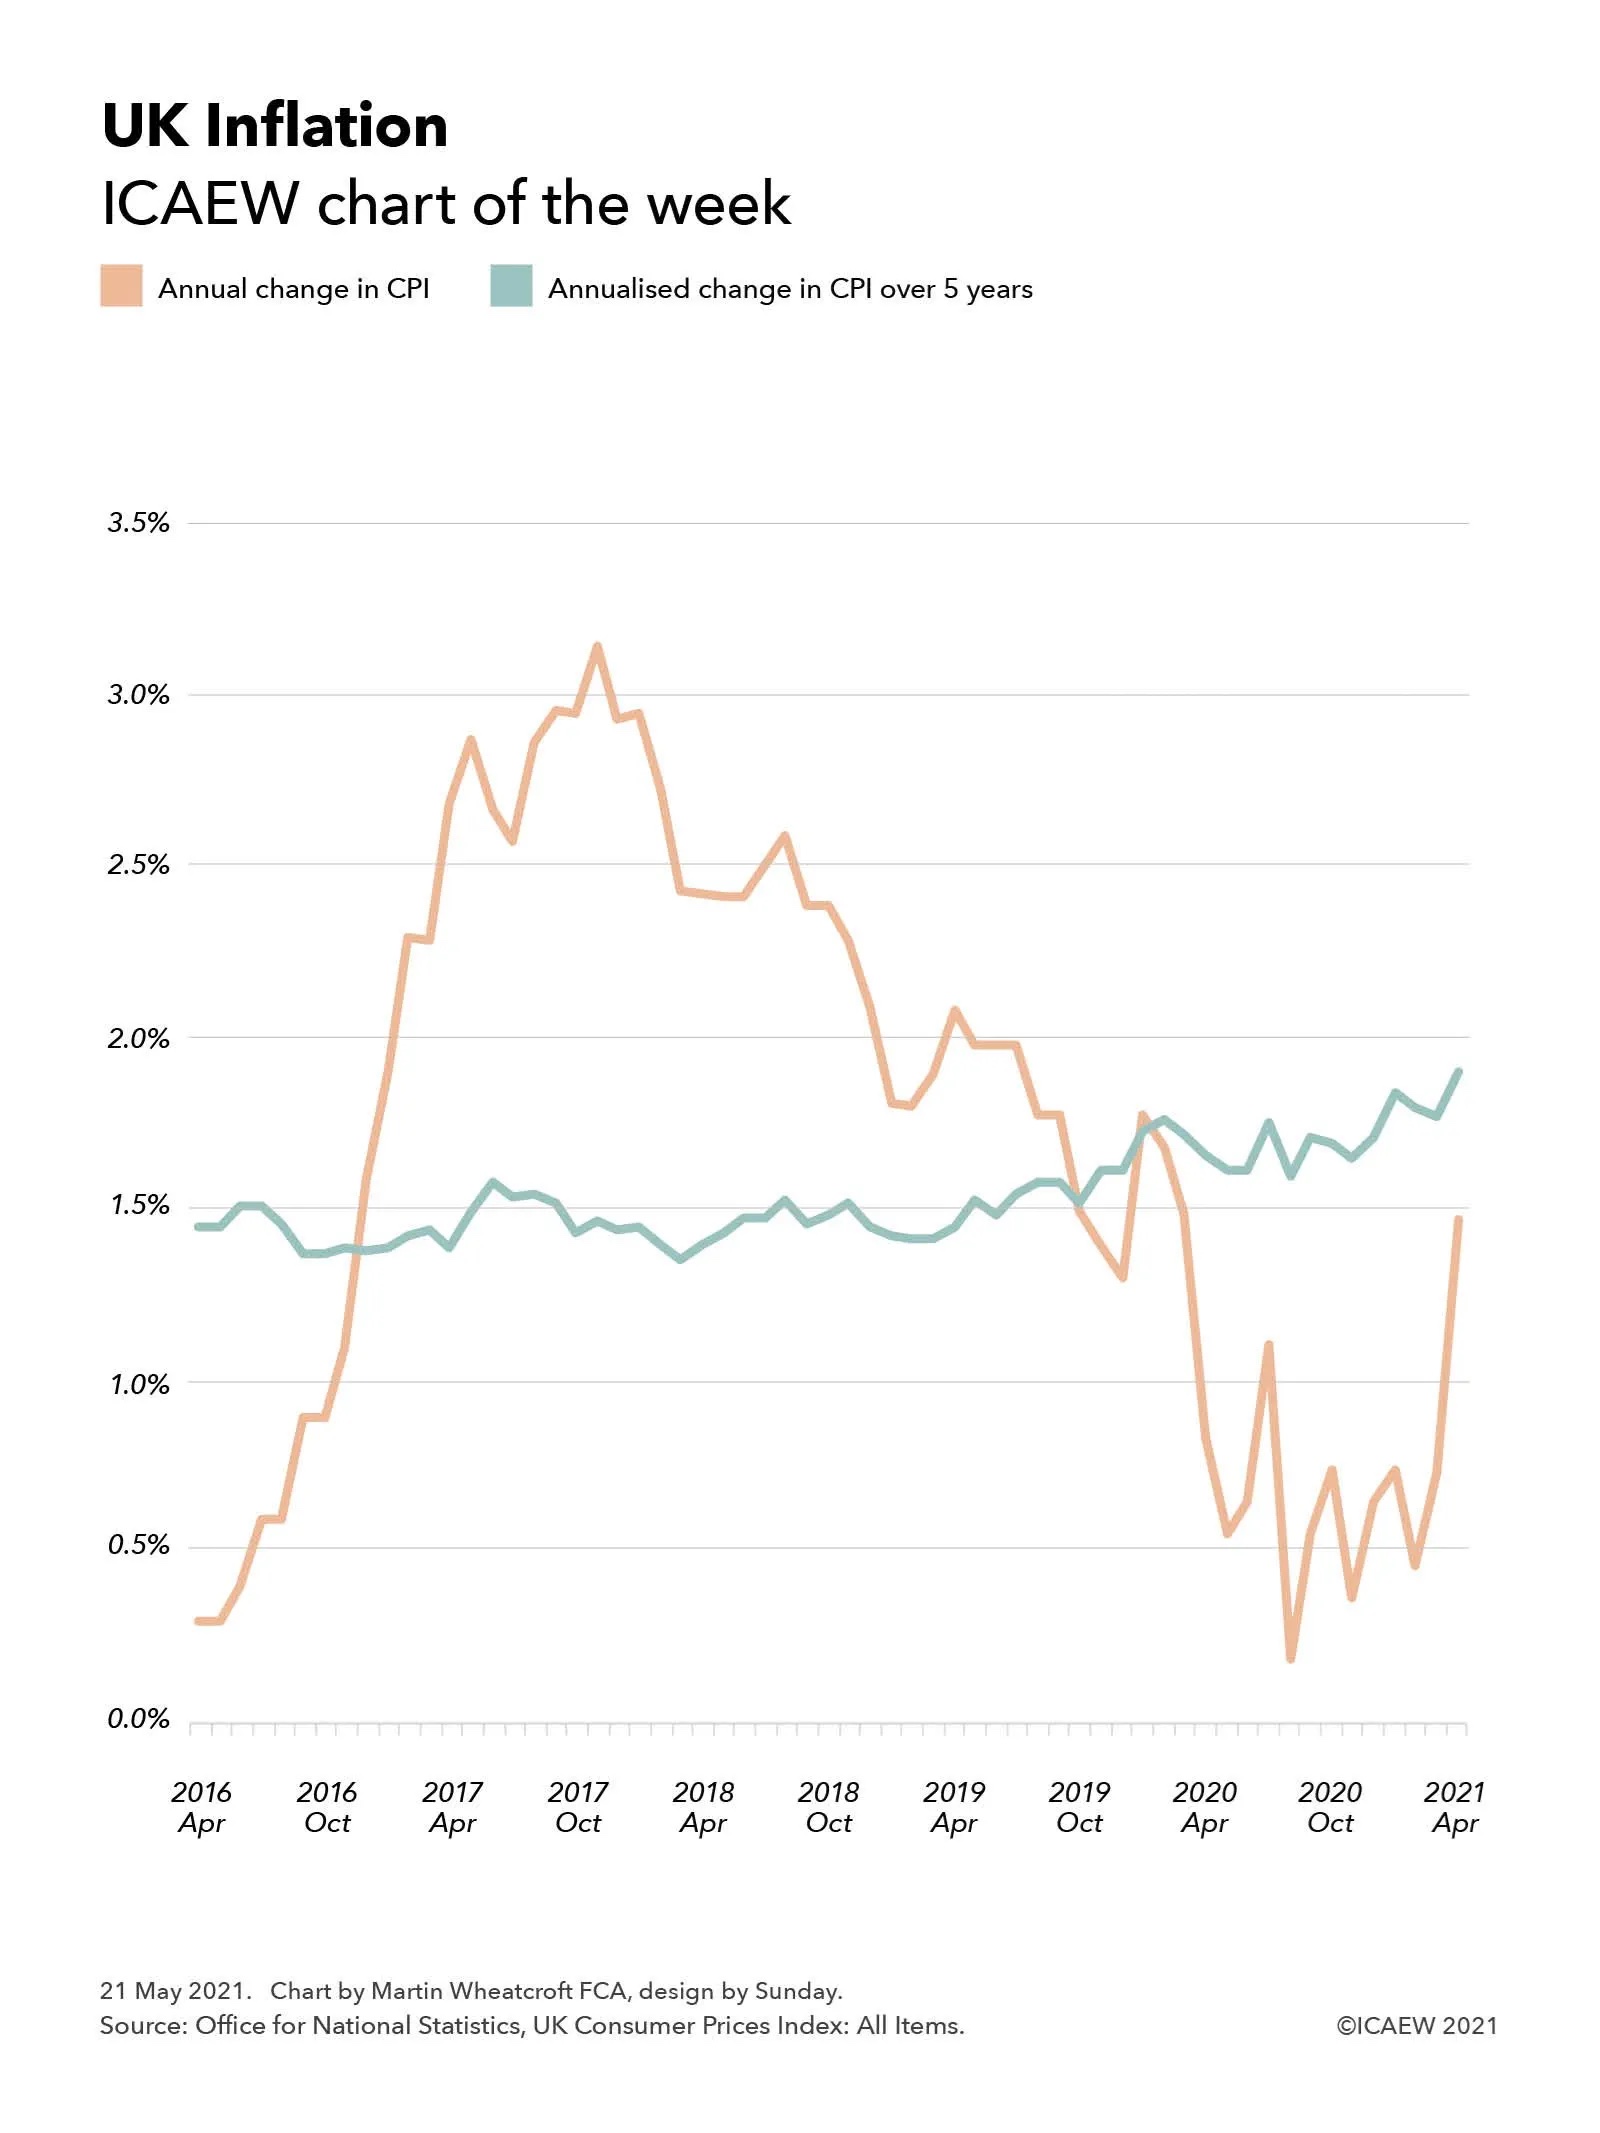
Our chart compares the annual rate of Consumer Price Index (CPI) inflation with a more stable measure, which is the annualised rate of CPI inflation over a five-year period. This is less susceptible to short-term swings in the economy, but as the chart shows, medium-term inflation has been gradually rising over the past five years even as headline rates on an annual basis fell over the last four years before the pandemic.
This perhaps explains some of the relaxed responses from economists about the sudden burst in inflation in the last month, given the annual rate of increase still remains below the medium-term trend, despite the current extraordinary economic circumstances.
Of course, that is not to say that inflation might not become a problem as the UK emerges further from lockdown. Many businesses have closed over the last year, particularly in the retail sector, while those that have survived will be looking to repair their balance sheets – a recipe for higher prices as constrained supply meets higher post-lockdown demand from consumers. Only time will tell whether this will feed into sustained higher levels of inflation or will jump be a temporary adjustment that falls out of the headline rate again in a year or so’s time.
