ICAEW chart of the week: One Big Beautiful Bill Act 2025

My chart for ICAEW this week looks at the impact on the US federal government deficit of the major tax and spending changes passed by Congress and signed into law by President Trump on 4 July 2025.
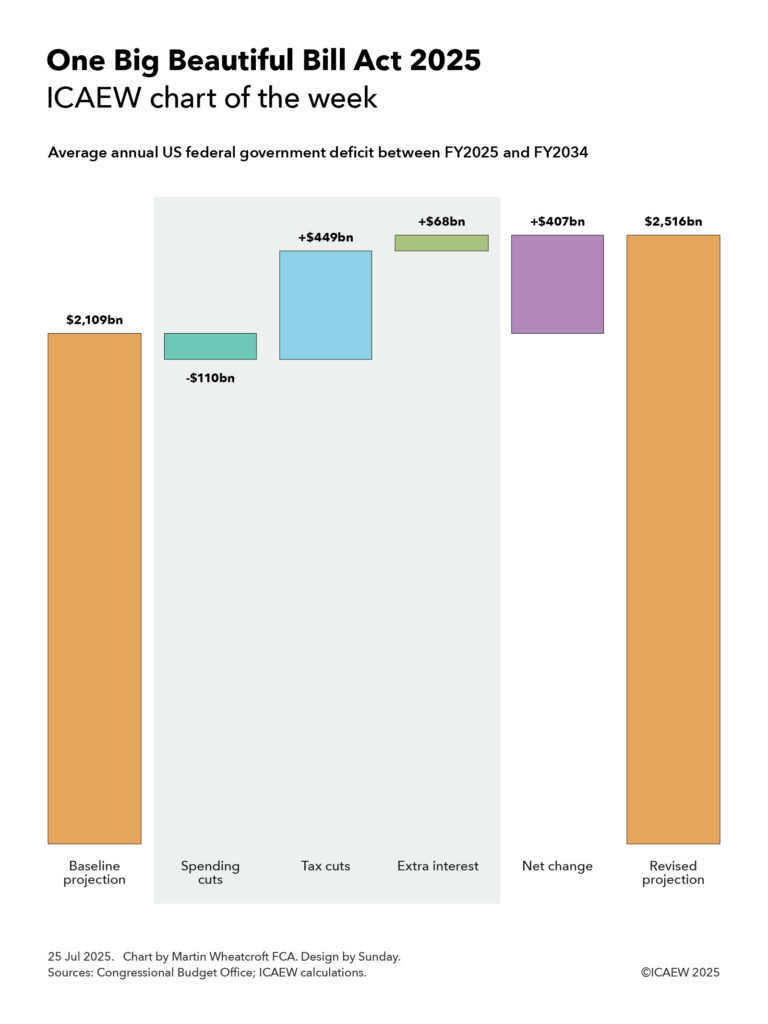
ICAEW chart of the week: A step chart showing the projected effect of the One Big Beautiful Bill Act 2025 on the average annual US federal government deficit between FY2025 and FY2034. 

Left hand column: Baseline projection $2,109bn. 

Steps 1 to 3 (shaded): Spending cuts -$110bn plus Tax cuts +$449bn plus Extra interest +$68bn. 

Step 4: Net change +$407bn (total of steps 1 to 3). 

Right hand column: Revised projection $2,516bn. 

25 Jul 2025. Chart by Martin Wheatcroft FCA. Design by Sunday. 
Sources: Congressional Budget Office; ICAEW calculations.

My chart this week looks at the impact on the US federal government deficit of the major tax and spending changes passed by Congress and signed into law by President Trump on 4 July 2025. 

The Congressional Budget Office (CBO) published on 21 July 2025 its assessment of Public Law 119-21 (the 21st law passed by Congress in its 119th session), also known as the One Big Beautiful Bill Act 2025 (OBBBA).

OBBBA was passed by Congress and signed into law by President Trump on 4 July 2025 and contains sweeping changes to the US federal tax system as well as a significant shift in spending priorities.

The chart this week attempts to illustrate the impact of OBBBA on the federal deficit by looking at how it changes the average annual projected deficit over the next 10 years from FY2025 (the current fiscal year ending on 30 September 2025) to FY2034, compared with the CBO’s baseline projection.

The baseline projection, published by the CBO in January 2025, was for the federal government deficit to increase from $1,865bn in FY2025 to $2,597bn in FY2034, an average deficit over the 10 years of $2,109bn or 5.8% of GDP.

According to the CBO, OBBBA is expected to increase the federal deficit each year by $339bn on average over the period to FY2034, with a net cut in federal spending of $110bn on average offsetting a net cut in revenues of $449bn. The CBO’s assessment does not take account of the additional cost of financing these higher deficits, which ICAEW calculates would add a further $68bn a year on average to the interest bill. 

The consequence is a net increase in the annual federal deficit of $407bn on average over 10 years, taking it to an average of $2,516bn or 7.0% of GDP.

Net spending cuts of $110bn comprise spending increases of $66bn a year on average, net of spending reductions of $164bn a year and incremental ancillary income that is deducted from spending of $12bn. Extra spending includes an extension of child tax benefits ($19bn a year on average) and more money for homeland security and immigration enforcement ($18bn), the military and coastguard ($17bn), farm subsidies ($5bn), air traffic control ($1bn), the mission to Mars ($1bn) and other items ($5bn). 

Spending reductions include cuts in Medicaid and Medicare programmes ($106bn on average each year), education and student loan relief ($30bn), other welfare and health programmes ($19bn), clean energy subsidies ($8bn) and other cuts ($1bn), while ancillary income comprises $9bn on average from spectrum auctions, $2bn from oil and gas leases, and $1bn extra from higher visa fees.

Net tax cuts comprise $511bn a year in tax cuts less $62bn a year in tax increases.

Tax cuts include making previous temporary tax cuts permanent ($379bn), business tax reforms ($97bn), personal tax reforms ($26bn), energy related tax credits ($4bn), Medicaid and Medicare related tax deductions ($3bn), and other ($2bn). Tax increases include the termination of tax reliefs for clean energy ($47bn a year), addressing tax loopholes ($6bn), additional immigration fees included in revenue ($4bn), taxing low-value international shipments ($4bn) and other ($1bn).

The CBO doesn’t directly conclude what this will mean for the US national debt (debt held by the public), which was expected in January’s baseline projection to increase from $28.2tn or 98% of GDP at the start of the current financial year to $49.5tn or 117% of GDP on 30 September 2034. Adding $4.1tn over 10 years to that amount suggests this would increase to $53.6bn or 127% of GDP.

These numbers don’t take account of the anticipated economic boost of lower taxes that should partially offset some of the tax impacts set out in the CBO’s analysis, as well as increasing the denominator in the deficit to GDP ratio. However, they also don’t take account of other factors such as US trade policy – including the additional tax receipts from tariffs and the potential effect that those higher taxes will have on the US economy – or many other policies of the US administration. We will need to wait for the CBO’s next full economic and fiscal projections later in the year to understand more about what that might mean.

Either way, the OBBBA will go down as one of the most consequential legislative acts of the US Congress in recent years.
This chart was originally published by ICAEW.

ICAEW chart of the week: Make America Indebted Again!

My chart for ICAEW this week looks at official projections, published three days before President Trump was inaugurated for the second time, that predict federal debt is on track to return to and exceed levels last seen in the 1940s.

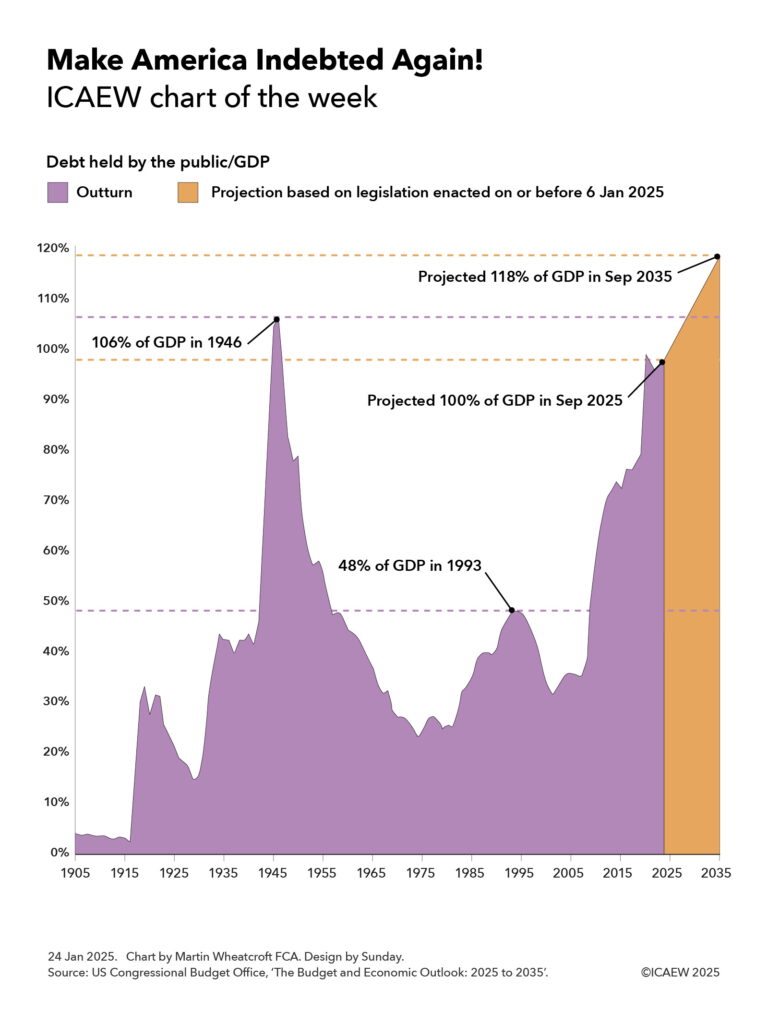
Shaded-area chart showing debt held by the public/GDP between 1905 and 2035, with highlighted peaks of 106% of GDP in 1946, 48% in 1993, a projected 100% in Sep 2025, and a projected 118% in Sep 2035.  

24 Jan 2025. Chart by Martin Wheatcroft FCA. Design by Sunday. Source: US Congressional Budget Office.

The US Congressional Budget Office (CBO) published its latest 10-year projections for the US federal government finances on 17 January 2025, covering the decade from 2025 to 2035. These projections are based on legislation enacted up to 6 January 2025, prior to the start of President Trump’s second term as President on 20 January 2025.

As the chart of the week illustrates, debt held by the public in relation to the size of the economy was 4% of GDP in 1905, falling to 3% in 1916 before rising to 33% of GDP as a result of the US entering the First World War. Debt/GDP fell over the subsequent decade to 15% of GDP in 1929 before rising again during the Great Depression to 42% of GDP in 1936. A drop to 40% in 1937 was then followed by a rise to 106% of GDP in 1946 following the end of the Second World War.

A rapidly growing economy over the next quarter of a century or so saw debt inflated away despite a major expansion in the size of the federal government over that period, with debt/GDP falling to 23% in 1974. More difficult economic times in the 1970s and 1980s and continued governmental expansion saw debt/GDP rise to 48% in 1993, before a growing economy again eroded debt as a share of GDP to down to 35% in 2007.

Debt rose rapidly during the financial crisis and subsequently, to reach 79% of GDP by 2019, before the pandemic drove it up further to 99% in September 2020. The post-pandemic economic recovery saw debt falling back to 95% of GDP in September 2022, but since then continued deficit spending since then has seen debt held by the public/GDP rise to 98% last year on its way to a projected 100% of GDP in September 2025.

The CBO predicts that debt held by the public will increase from $28.2tn at the end of September 2024 to $30.1bn in September 2025 and then to $52.1tn in September 2035, equivalent 118% of GDP. This assumes economic growth of 1.8% a year over the ten years to 2035 and is based on extrapolating from approved budgets and legislation in place as of 6 January 2025.

The big question is how that projected path will change as a result of the incoming Trump administration. His plan to cut taxes (pushing up the level of borrowing further) and to cut federal spending (offsetting some of that increase) will have a direct fiscal impact, but the indirect effects his policies have on the US economy will also be very important. Faster growth would have the effect of slowing the rise in the debt/GDP ratio or even bringing it down, while slower growth could shorten the time it takes to make America as indebted as it was back in 1946.

For further information, read the CBO’s ‘Budget and Economic Outlook: 2025 to 2035’.

This chart was originally published by ICAEW.

ICAEW chart of the week: US federal budget baseline projections

19 February 2021: Congressional Budget Office expects a decade of trillion-dollar deficits as the US public finances are hit by the pandemic.

The US Congressional Budget Office (CBO) recently updated its ten-year fiscal projections for the federal budget, providing the subject for this week’s #icaewchartoftheweek. 

As the chart illustrates, there was a shortfall of $3.1tn between revenues and spending by the federal government in the year ended 30 September 2020, with a projected deficit of $2.3tn in the current financial year and deficits ranging from $0.9tn to $1.9tn over the coming decade.

The CBO is at pains to stress that its projections are not a forecast of what will happen but instead, provide a baseline against which decisions can be assessed. This is particularly relevant at the moment as Congress debates a potential $1.9tn stimulus plan that would increase this year’s deficit significantly if passed.

On the path shown in the projections, the CBO calculates that debt held by the public will increase from $21.0tn (100% of GDP) in 2020 up to $35.3tn (107% of GDP) by 2031. Will policymakers in the US be comfortable in continuing to run with such a high level of debt compared with pre-pandemic levels of around 80% of GDP and a pre-financial crisis level of less than 40%?

The projections are based on assumed economic growth excluding inflation of 4.6% in the current financial year following on from a fall of 3.5% last year, with the recovery continuing into 2022 with growth of 2.9%. Economic growth over the following nine years to 2031 is expected to average around 1.9%. This is much lower than the average rate of growth experienced before the financial crisis just over a decade ago but may still prove optimistic given the potential for a recession at some point over the next ten years.

The UK counterpart to the CBO – the Office for Budget Responsibility (OBR) – is currently working its abacus quite hard on updating its five-year projections ready for the Budget on 3 March. The OBR’s projections will be extremely useful in understanding the near-term path in the UK’s public finances, including the effect of any tax and spending announcements that may be featured in the Budget. Unfortunately, they will be less useful than the CBO’s projections in that they are not expected to provide a refreshed baseline for the second half of the decade when the hard work of starting to repair the public finances is expected to take place.

This chart was originally published by ICAEW.