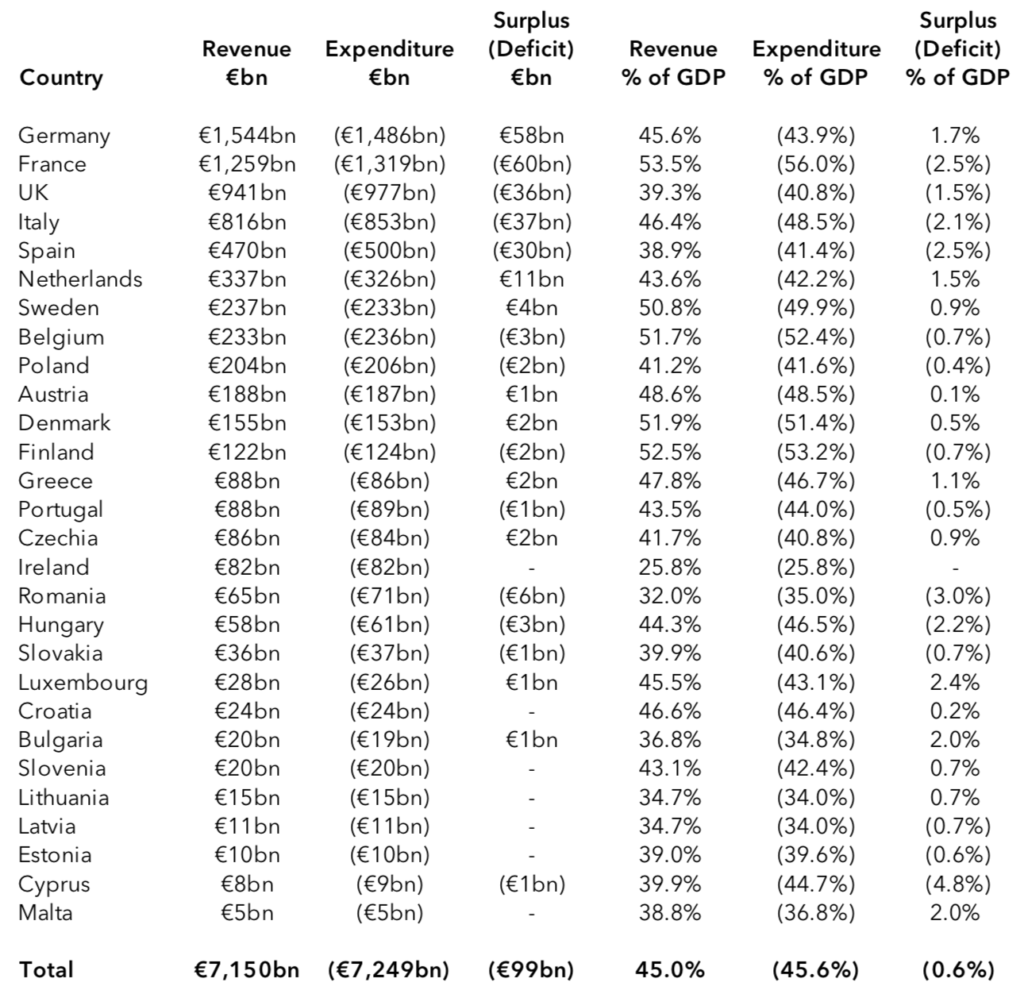
ICAEW chart of the week: UK international trade

For some reason the UK’s international trade arrangements with other countries are a continuing topic of debate, and so we turn to imports and exports for this week’s ICAEW #chartoftheweek.

According to provisional numbers from the Office for National Statistics published last week, imports of goods and services are estimated to have been in the order of £660bn in 2018, while exports were around £630bn, a net trade deficit of £30bn. This comprises a deficit on goods of £140bn (imports of £490bn versus exports of £350bn) and a surplus on services of £110bn (imports of £170bn compared with exports of £280bn).

The largest proportion of the UK’s trade is with the EU, comprising around 55% of imports and 45% of exports. Within the EU, Germany is the  (imports of £85bn and exports of £58bn), followed by the Netherlands (£48bn and £36bn), France (£43bn and £40bn), Ireland (£24bn and £31bn), Spain (£32bn and £17bn), Belgium (£30bn and £19bn) and Italy (£26bn and £20bn).

The US, still the largest economy in the world, is the UK’s largest individual trading partner, with the UK importing goods and services in the order of £75bn from, and exporting £117bn to, the US in 2018. The next largest trading partner outside the EU is China, with imports of £58bn and exports of £30bn.

With the UK scheduled to depart the EU in less than 40 days’ time, there is still a great deal of uncertainty as to what the UK’s post-Brexit trade arrangements will be – and hence the potential effect on international trade from April onwards.

ICAEW chart of the week: UK railway finances

This week’s #ICAEWchartoftheweek is on the UK rail industry’s finances for 2018-18, the subject of a recent report by the Office of Rail and Road.

Although the ORR tries to explain the way money flows through the industry (see below), with payments to and from the different players, we thought we would try and provide a high level overview that summarises the £20.5bn needed in total by the railways last year.

Broadly the train operating companies and Network Rail together generated £12.4bn in revenue, of which £9.8bn came from passenger fares. This is 60% of the total, with taxpayers contributing the balance of £8.1bn (40%) in the form of subsidies, public borrowing and losses by the state-owned Network Rail. 

This was used to fund £10.8bn in train company and Network Rail operational costs, £7.7bn in Network Rail capital expenditure and rolling stock leases, and £2.0bn in Network Rail debt interest. (This does not include the £1bn or so incurred in 2017-18 by the Department for Transport on the new HS2 line between London and Birmingham.)

With fares continuing to rise ahead of inflation, high levels of passenger dissatisfaction, and precarious finances, the railways are likely to continue to depend on government support for the foreseeable future.

ICAEW chart of the week: UK Defence Equipment Plan

A scathing report on the UK Defence Equipment Plan released last week by the Public Accounts Committee provides the subject matter for the #ICAEWchartoftheweek. This follows on from a National Audit Office review of the Ministry of Defence’s plans to spend £186bn on equipment between 2018 and 2028 and the prospect of £7bn to £15bn of overruns. 

We looked at this as part of the IFS Green Budget 2018 in a chapter on defence finances. This highlighted how the long-term decline in defence and security spending is at an end as it gets close to the 2.0% minimum NATO commitment, as well as the challenges in improving financial management within the MoD.

As our chapter concluded, the strategic choice for the UK is to match its aspirations for a global military role to the amount it is willing to spend on defence. We are still waiting for the Spending Review to see what the Government decides.

ICAEW on Defence in the IFS Green Budget 2018 – https://www.ifs.org.uk/publications/13493

Public Accounts Committee report on the Defence Equipment Plan – https://www.parliament.uk/business/committees/committees-a-z/commons-select/public-accounts-committee/news-parliament-2017/mod-equipment-plan-report-publication-17-19/

National Audit Office report on the Defence Equipment Plan – https://www.nao.org.uk/report/the-equipment-plan-2018-to-2028/

ICAEW chart of the week: UK workforce statistics

The good news from the ONS last week is that the unemployment rate is down and the employment rate is up. 

But, while the trends are encouraging, the statistics are a little confusing. After all, why does unemployment of 4.0% plus employment of 75.8% not add up to 100%? 

We delve into the mysterious world of UK workforce statistics for the #ICAEWchartoftheweek.

Let’s start with the unemployment rate, which excludes 19.26m ‘economically inactive’ individuals from the calculation. These comprise 11.73m in retirement, 2.27m students, 2.05m homemakers, 1.98m long-term ill and 1.23m not working for other reasons.

The employment rate calculation includes most of these, but not 11.90m people aged 65 or more (1.28m of whom are in work). On this basis the rates do add up to 100%, with employment of 75.8%, unemployment of 4.2% and economically inactive of 21.0%.

One mystery solved, but another is why the ONS don’t publish the share of those in work out of the total population? We estimate this to be 48.9%, meaning that less than half of all people living in the UK are actually in employment.  

This seems to us to be extremely important to know given the increasing pressures being placed on the public finances as more people live longer.

Brexit uncertainty a concern for the public sector finances, say ICAEW

Commenting on the public sector finances for December 2018, published today by the ONS, Martin Wheatcroft FCA, advisor to ICAEW on public finances, said:

“As predicted going into 2019, the public finances are continuing on an improving trend. However, with Brexit looming ever closer and a deal yet to be agreed, there are significant downside risks to the forecasts for the 2019-20 financial year, scheduled to start just two days after the UK plans to leave the EU on 29 March 2019.

The gap between government revenue and public spending is currently expected to narrow to less than £3bn a month in 2019-20, assuming a transition period that maintains the UK’s position in the Single Market until the end of 2020. A disruptive break in the UK’s trading relationship with European markets could adversely affect both tax receipts and expenditures. Some tough decisions would be required in the resulting second Budget that the Chancellor indicated in November 2018 would be necessary if the Brexit deal was not accepted by Parliament.

The attitude of debt investors to the developing situation will also be important as the government needs to refinance £200bn of its existing debt over the course of 2019 and 2020, in addition to raising £100bn in new finance. Higher costs for government borrowing are a real possibility.

Until there is greater clarity from Parliament and the EU on a new plan for Brexit, the outlook for the public finances will remain uncertain.”

ICAEW chart of the week: EU budget 2019

The #ICAEWchartoftheweek this time is on the subject of the EU’s 2019 budget of €148bn. This is in the order of £130bn at current exchange rates, equivalent to €24 per month for each of the 514m people in the EU. 

Of this, €10bn is for EU institutions, with €25bn to be incurred on its main programmes. The big numbers are €57bn for agriculture and rural communities, and €47bn for economic development. A further €9bn is planned in international aid outside the EU.

Not shown in the chart is an increase in future commitments of €18bn – amounts authorised but not yet paid out, such as multi-year research or development grants.

The UK’s share for 2019 is £15bn, but with £6bn expected to come back, the net cost should be £9bn (£11 per person per month), just over 1% of planned UK government spending in 2019-20 of £842bn.

What will happen if the UK’s agreed transition period contributions of £16bn in 2019 and 2020 and post-transition payments of £21bn are not paid in full? Although the UK is expected to prepay around £3bn before the end of March (not included in the £16bn), that will only last so long if it leaves without a deal.

One certainty is that the finance team at the European Commission will need a full range of scenario planning skills to deal with all the possibilities.

ICAEW chart of the week: Austerity in English local authorities

The news of the proposed appointment of Gareth Davies to be the new Comptroller & Auditor General for the UK prompted us to look at the National Audit Office website. There we saw one of its current highlights – a fascinating set of data visualisations derived from a major report published last year on the financial sustainability of local authorities in England.

This has inspired this week’s ICAEW #chartoftheweek, which illustrates just how significantly local government spending has been cut in recent years. Annual net expenditure by English local authorities has fallen by £7.0bn or 16% from £43.7bn in 2010-11 (in 2016-17 prices) to £36.7bn in 2016-17.

Spending on planning and development is less than half what it was, while spending on housing support has almost halved. Budgets for transport (highways and public transport) and culture (including libraries, open spaces, sport and tourism) have been cut by over a third, while spending on waste collection, environmental regulation and administration have also been cut. While spending on adult social care is ‘only’ down by 6%, this conceal a much more dramatic cutback in services given the significant growth in the number of older people needing care. Only children’s social care has increased by more than inflation, and then only slightly.

With reports that more and more local authorities are struggling financially, there are many questions to ask about this often neglected area of the public finances.

We look forward to hearing what areas Gareth Davies will be exploring in his tenure. We hope that he will build on the legacy of the current C&AG Sir Amyas Morse to drive improvements in the public finances on behalf of the citizens of the UK.

To find out more, visit the NAO website for more data visualisations on the financial sustainability of English local government – https://www.nao.org.uk/highlights/financial-sustainability-of-local-authorities-2018-visualisation/.

To comment on this, visit ICAEW Talk Accountancy blog at https://ion.icaew.com/talkaccountancy/b/weblog/posts/chartoftheweek062

ICAEW chart of the week: The global economy in 2019

The first ICAEW #chartoftheweek for 2019 is on the subject of the global economy, with GDP forecast to add up to £69tn in 2019 based on data provided by the IMF.

The UK is expected to generate £2.2tn in economic activity in 2019, just over 3% of the world total. This reflects the UK’s position as a relatively rich country given that its 67m people make up less than 1% of the global population of 7.6bn.

Sterling weakness means that the UK is expected to be only the seventh largest economy in 2019, behind the US (£17.7tn), China (£11.3tn), Japan (£4.1tn), Germany (£3.2tn), India (£2.4tn) and France (£2.2tn). However, it should still be significantly ahead of Italy (£1.7tn), Brazil (£1.5tn), South Korea (£1.3tn), Canada (£1.3tn), Russia (£1.2tn), Spain (£1.1tn), Australia (£1.1tn) and Mexico (£1.0tn).

With Brexit scheduled for the end of Q1 and the potential for escalation in the US’s trade wars with China, Japan and the EU, is a world of strong economies possible in 2019? The only certainty is uncertainty.

However, despite the potentially stormy economic conditions ahead, we remain optimistic for the future. Poverty continues to fall around the world, and new innovations continue to improve the lives of billions of people.

And with that more cheery note, we wish you all the best for the coming year.

ICAEW chart of the week: Santa’s UK P&L

Our final #ICAEW #chartoftheweek for 2018 is on the subject of Santa plc, the UK subsidiary of Santa Claus, Inc (“Santa”).

As many of you will know, Santa is one of the world’s largest gift delivery firms with a rather magical business model. After several hundred years of never recording a loss (admittedly never a profit either), Santa has built up one of the highest levels of goodwill that we are aware of, with a consistent track record of growing revenues.

A shining star of the elf-sector of the economy.

As our chart illustrates, Santa is expected to deliver presents worth £13.2bn in 2018, with an average value of around £475 dropped down each chimney. Around 20% of these will have been purchased online, up from around 6% a decade ago as Santa’s cloud-based modernisation programme continues to drive market dynamics.

However, markets and high street stores continue to be the main acquisition pipeline for inventories in the lead up to Christmas, with narrow delivery timescales continuing to be a major operational challenge for Rudolph and the rest of the logistics team.

I do hope that you will have a wonderful break and a prosperous 2019. 

ICAEW chart of the week: Retail spending 2018

With the festive season upon us and despite tales of High Street gloom, our chart this week is about the £381bn that consumers in England, Wales and Scotland are expected to spend in 2018 on the high street and online. A weekly average of £7.3bn via the multiplicity of payment routes that are possible.

As our chart illustrates, the pattern of spending through the year is significantly skewed to the holiday season, with retail sales excluding fuel in the five weeks ending in December expected to reach almost £48bn. This is a massive £11.1bn higher than if consumer spending was spread evenly through the year.

It is important to understand that the chart is based on an extrapolation from last year’s pattern and is not a forecast. If consumers choose to tighten their belts this year then sales could come in substantially below this level. Such a scenario would add to the woes of a number of retailers, many of whom generate most of their profits in the weeks running up to the end of the year.

So if you are out looking for that last minute present for someone special, just remember that this is a great opportunity to make your retailer happy too!