12 February 2021: The UK wrote to New Zealand at the start of this month formally requesting permission to apply for membership of the Comprehensive and Progressive Trans-Pacific Partnership. What is the CPTPP and what opportunities would joining provide to the UK?
The #icaewchartoftheweek is on the UK’s application to join the Comprehensive and Progressive Trans-Pacific Partnership (CPTPP), a group of eleven countries on the other side of the world. This trade organisation was established to improve trade links between countries surrounding the Pacific, reducing trade barriers between the countries involved and aligning regulations in areas such as intellectual property.
It is sometimes described as the third largest free-trade area in the world, after the US-Mexico-Canada Free Trade Agreement (USMCA, formerly NAFTA) and the EU-EEA-Switzerland Common Market, but it is important to understand that it is much less integrated than a customs union (with shared tariffs), a common market (with fuller regulatory alignment) or an economic union (such as the highly integrated EU Single Market with unified standards and regulations).
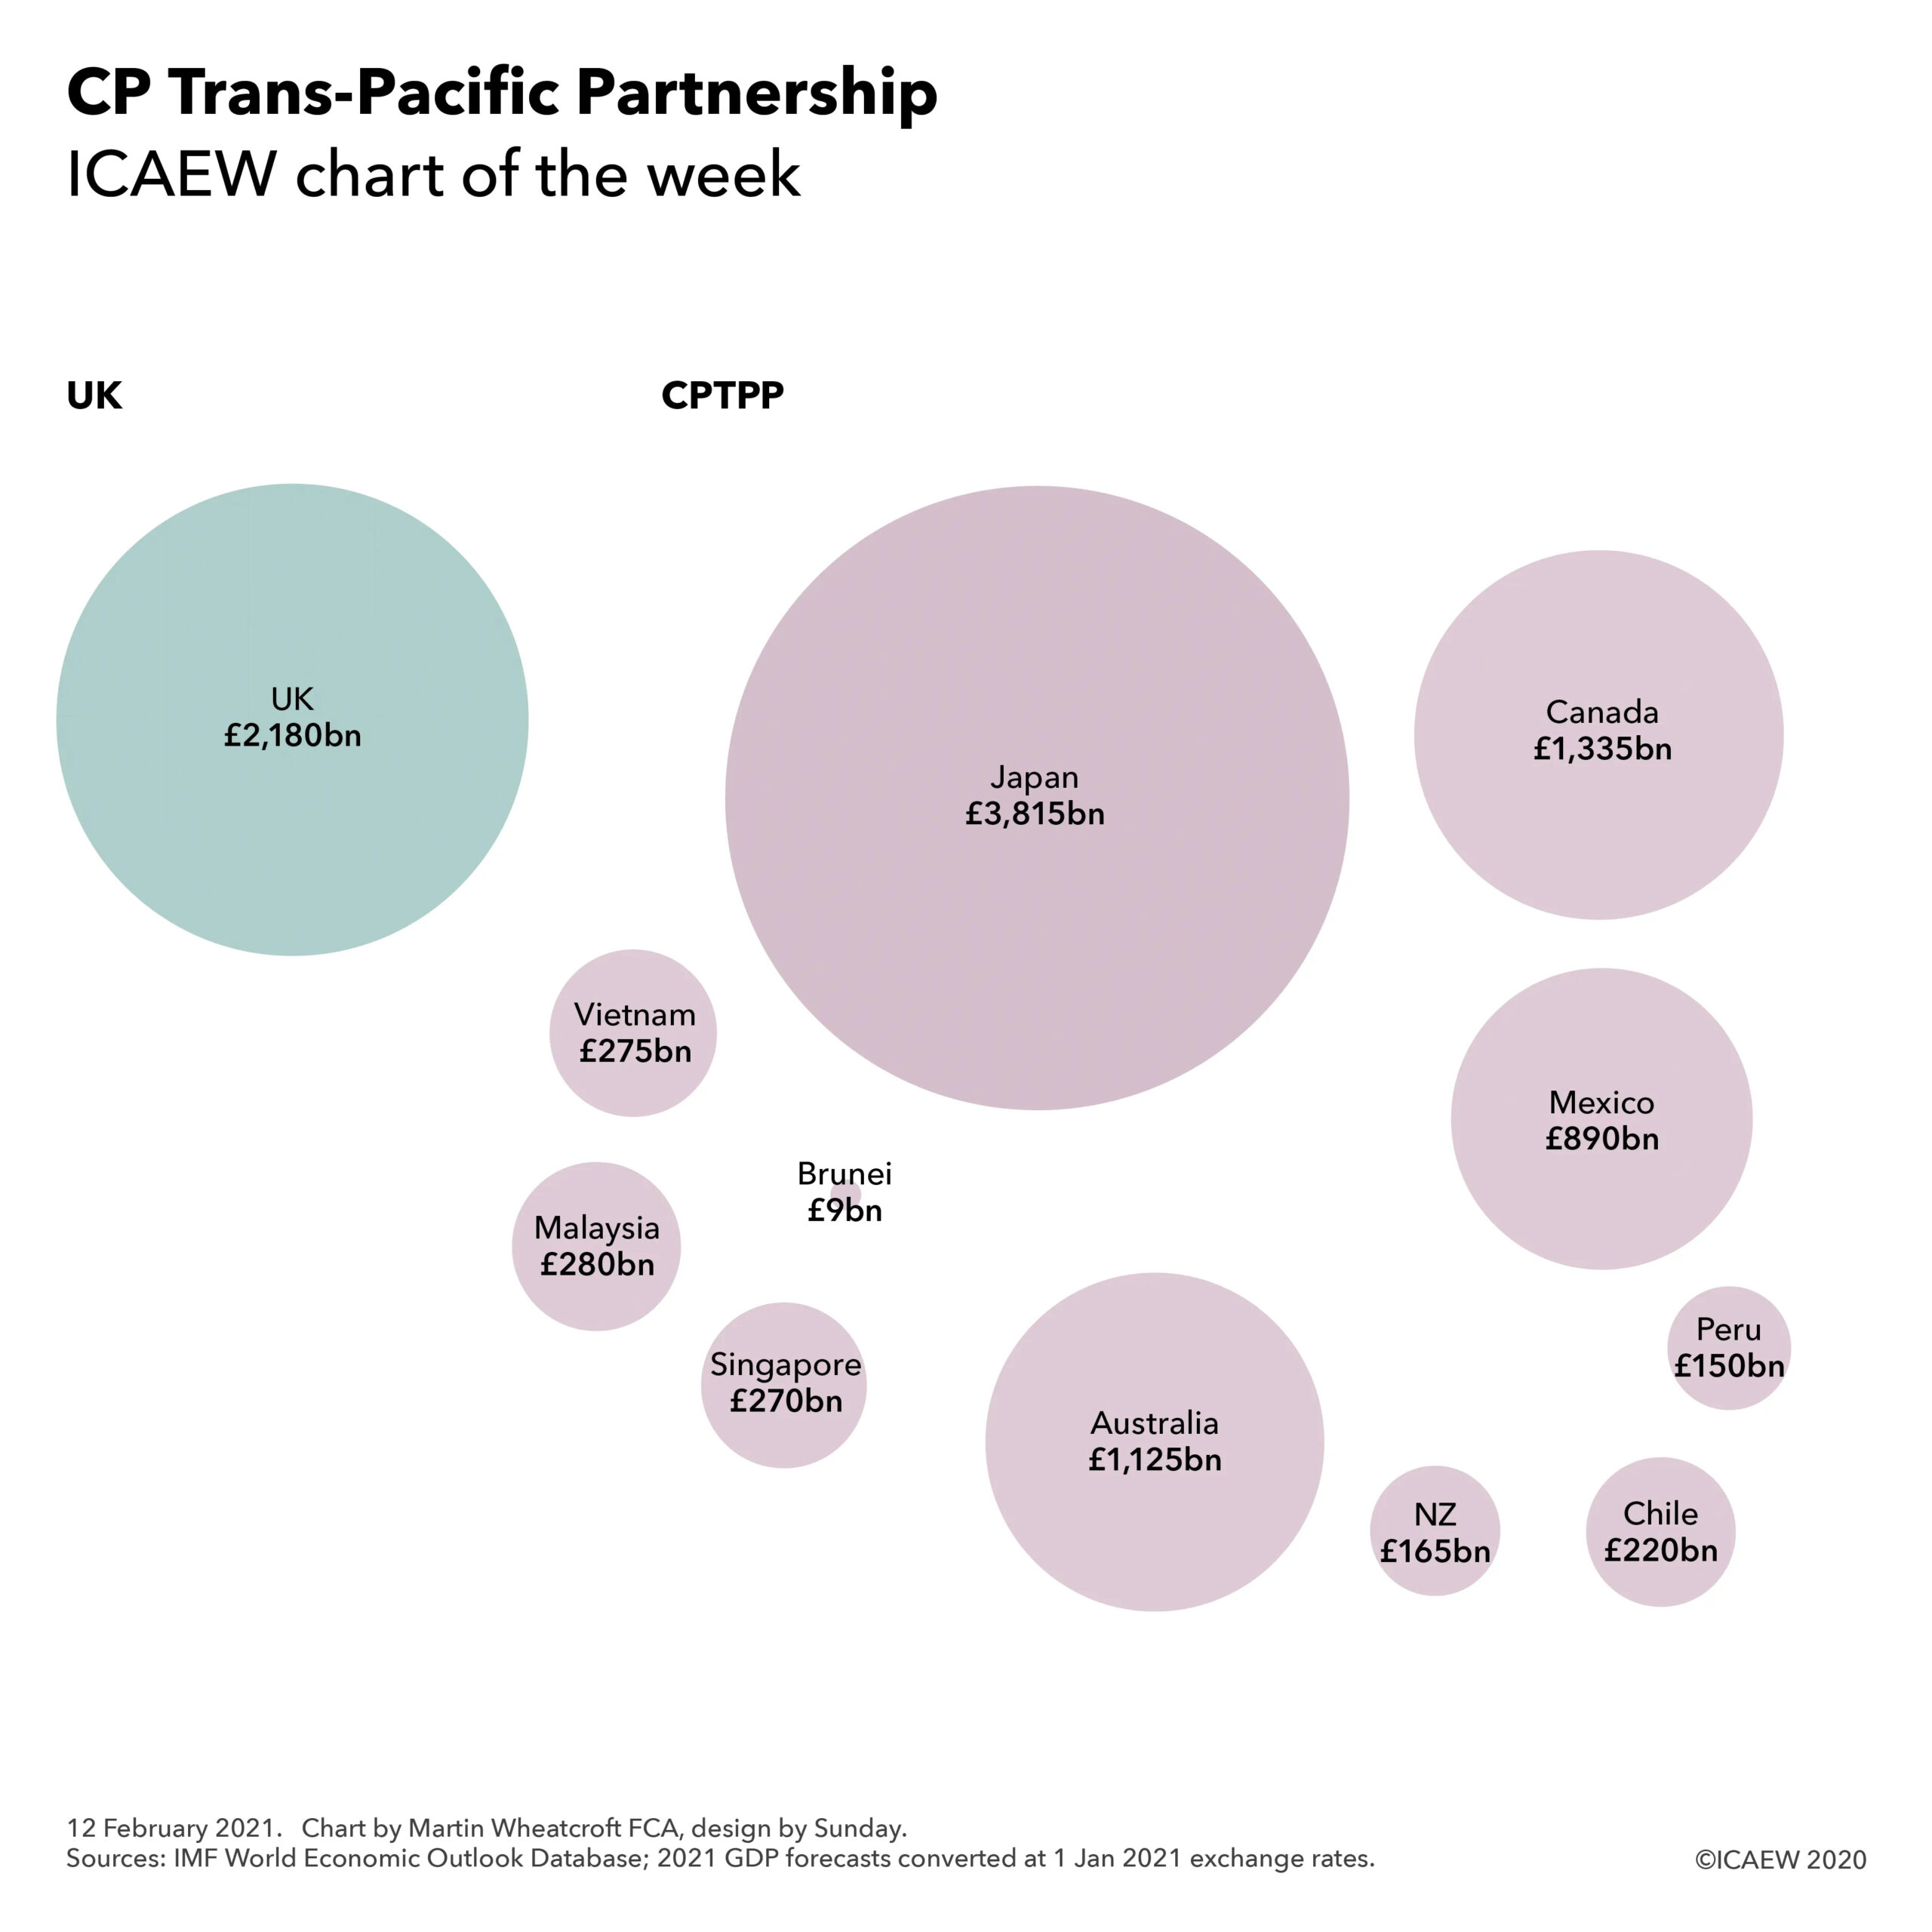
According to IMF forecasts for 2021, Japan is the largest economy in the CPTPP with GDP of £3,815bn, while Brunei is the smallest with GDP of £9bn. The other members are Canada (£1,335bn), Australia (£1,125bn), Mexico (£890bn), Malaysia (£280bn), Vietnam (£275bn), Singapore (£270bn), Chile (£220bn), New Zealand (£165bn) and Peru (£150bn). This compares with a forecast of £2,180bn for UK GDP in 2021.
Membership is not exclusive, with CPTPP members involved in a number of other multilateral free trade agreements. Canada and Mexico are also members of USMCA. Malaysia, Singapore, Vietnam and Brunei are members of the 10-nation Association of South East Asian Nations (ASEAN), which in turn has free trade agreements with Japan, Australia and New Zealand, China, India and South Korea. Mexico, Peru and Chile are members of the four-nation Pacific Alliance with Columbia. In addition, China is leading the formation of the Regional Comprehensive Economic Partnership which includes all of the non-Americas members of the CPTPP in addition to China, South Korea and the other members of ASEAN.
The CPTPP replaced the original proposal for a Trans-Pacific Partnership (TPP) that would have included the US, but the remaining nations decided that it was still worthwhile pursuing a revised trade arrangement even after the US withdrew its application four years ago. A new administration could see the USA change its mind and seek to join the CPTPP after all.
Why does the UK want to join a trade pact on the other side of the world? The immediate trade benefits are likely to be relatively modest given the distances involved and which are likely to be secured through bilateral trade agreements already under discussion.
One reason is likely to be geo-political, as membership would strengthen relationships with allies in the Pacific, advancing the UK Government’s ‘global Britain’ agenda. There may also be an advantage in being directly involved in the development of international trade policy in the Pacific region which contains the two largest individual economies in the world (the US and China), potentially influencing trade policy across the planet.
Of course, part of the motivation might be less about trade in the Pacific and more about trade across the Atlantic. After all, if the US were to join the CPTPP, the UK’s membership might provide a base from which to eventually develop a more comprehensive bilateral free trade agreement. This could fulfil a key strategic objective of improving trade ties with the USA by going around the world, albeit in a lot more than 80 days!