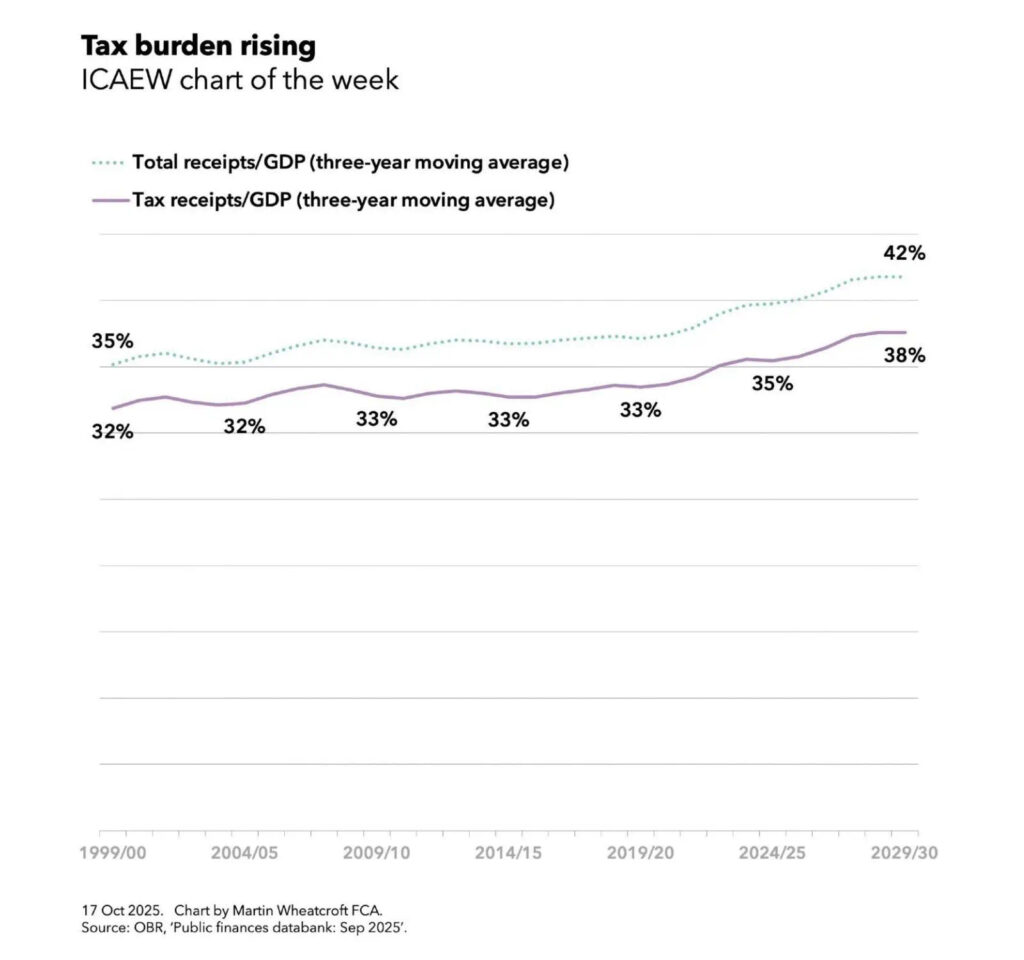
My chart for ICAEW this week shows how tax receipts as a proportion of national income have risen significantly since the turn of the century, begging the question as to whether taxes are too high or the UK economy is too small?

My chart of the week for ICAEW illustrates how tax receipts as a percentage of GDP averaged 32% over the three years to 1999/00, 32% to 2004/05, 33% to 2009/10, 33% to 2014/15, 33% to 2019/20, 35% to 2024/25 and are projected to hit 38% over the three years to 2029/30, based on data from the Office for Budget Responsibilities’ public finances databank for September 2025.
The chart also shows how total receipts including non-tax income averaged 35% in the three years to 1999/00 and a projected 42% to 2029/30.
The one caveat to these percentages is that they do not reflect recent revisions by the Office for National Statistics that increase GDP by the order of 1% across multiple years, which will cause the reported percentages to be a little smaller when they are recalculated by the OBR for the Autumn Budget 2025.
Either way, a projected rise of approaching 20% in the proportion of the economy taken in taxes since the end of last century is pretty significant, even if the projected tax burden will be lower than those of many countries in Europe.
The chart doesn’t show public spending as a proportion of national income. This averaged 35% of GDP over the three years to 1999/00 and 45% of GDP over the three years to 2024/25, with more people growing older driving up the cost of pensions, health and social care significantly and a much higher bill for debt interest being two of the main factors driving up costs.
Public spending as a share of national income is projected to fall slightly to an average of 44% over the three years to 2029/30 as the government tries to reduce the shortfall between total receipts and spending (aka the deficit) through a combination of higher taxes (as announced in the Autumn Budget 2024) and some constraint in public spending over the next five years.
Unfortunately, a lack of fiscal headroom, a disappointing economic outlook, and cost pressures are now expected to lead the Chancellor to increase taxes even further in the Autumn Budget 2025. This suggests that taxes may be too low, at least if the government is to deliver the level of public services and welfare provision it is committed to.
If taxes are not too high, then the problem must be that the economy is too small. This is evidenced by low productivity growth since the financial crisis and successive economic shocks that have together resulted in a UK economy that has not grown at anywhere near the speed it might have.
If tax cuts are unlikely, at least in the medium-term, the principal route to reduce the tax burden must be to drive up economic growth, as called for in ICAEW’s business growth campaign. This calls for the government to focus on business growth by addressing the many factors that make it too uncertain, too difficult and too expensive to do business in the UK.