ICAEW chart of the week: dismal times (per capita)

Two quarters of shallow negative GDP growth may be just enough for the UK to be in a mere ‘technical’ recession, but seven successive quarters of negative GDP growth per capita present a more worrying picture.

Dismal times (per capita)
ICAEW chart of the week

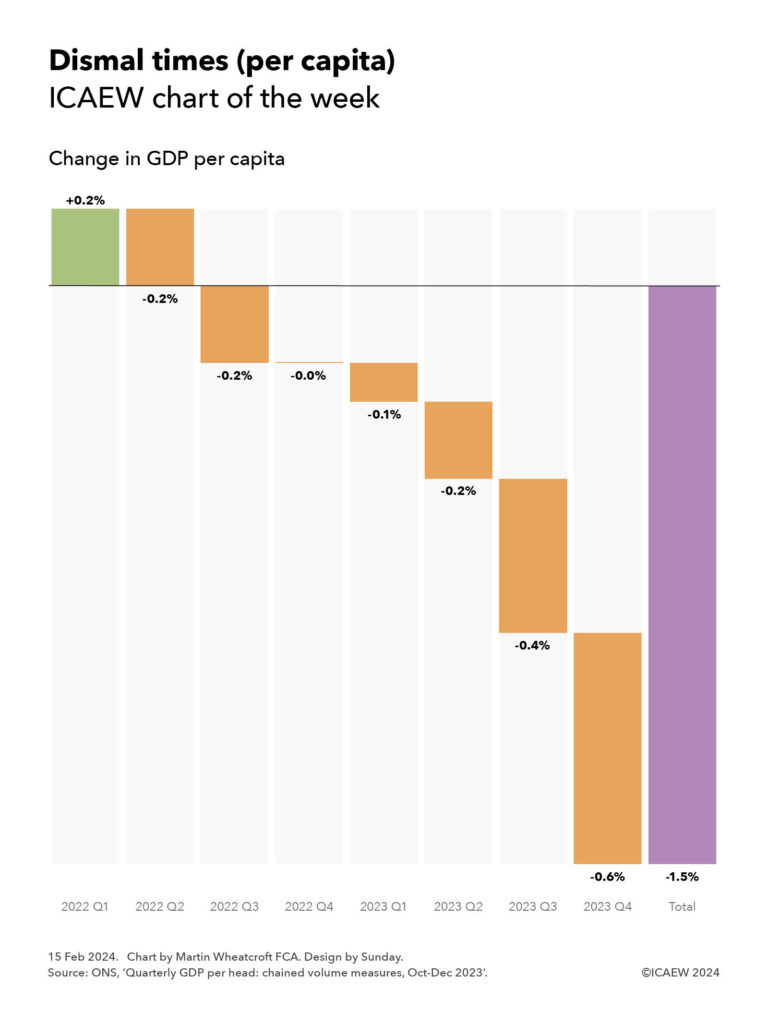
Step chart for the eight calendar quarters in 2022 and 2023 together with the total change over that period.

Change in GDP per capita

(Quarterly increases in green, quarterly decreases in orange, total decrease in purple)
 
2022 Q1: +0.2%
2022 Q2: -0.2%
2022 Q3: -0.2%
2022 Q4: -0.0%
2023 Q1: -0.1%
2023 Q2: -0.2%
2023 Q3: -0.4%
2024 Q4: -0.6%
Total: -1.5%


15 Feb 2024.
Chart by Martin Wheatcroft FCA. Design by Sunday.
Source: ONS, 'Quarterly GDP per head: chained volume measures, Oct-Dec 2023'.

(c) ICAEW 2024

The Office for National Statistics (ONS) released its latest statistics on quarterly GDP on 15 February 2024, reporting that GDP in the fourth quarter of 2023 (October to December) had fallen by 0.3% compared with the previous quarter, which in turn was 0.1% below the quarter before that. This was sufficient for the UK to meet one of widely accepted definitions of a recession: two successive quarters of economic contraction. 

Many economists have chosen to describe this as a ‘technical’ recession given how shallow the fall in growth has been over the past two quarters, very different from the scale of contraction seen in ‘proper’ recessions such as that experienced during the financial crisis (when GDP fell in the order of 6% over four successive quarters). The ‘technical’ label also emphasises how relatively small subsequent revisions to the quarterly statistics could easily lift the UK out of recession again.

Perhaps more worrying for all of us living in the UK are how changes in GDP per capita have been negative over the past seven quarters, as illustrated by our chart this week. GDP per person can often be more important to individuals than the overall change in GDP given how living standards are, by definition, experienced on a per capita basis.

According to the official chained volume measure of GDP per head, economic activity per capita grew by 0.2% in the first quarter of 2022 (over the previous quarter) but has declined since then: by -0.2%, -0.2% and -0.0% respectively in the second, third and fourth quarters of 2022, and then -0.1%, -0.2%, -0.4% and -0.6% in the first, second, third and fourth quarters of 2023.

Overall, this is equivalent to a reduction of 1.5% in GDP per head between the fourth quarter of 2021 and the fourth quarter of 2023, although one additional note of caution is that the per capita numbers are based on population projections that are even more susceptible to revision than estimates of the size of the economy. Despite that, these numbers are not a sign of an economy doing well.

The per capita numbers put the reported GDP growth rates for the same eight quarters of +0.5%, +0.1%, -0.1%, +0.1%, +0.2%, +0.0%, -0.1%, and -0.3% respectively (equivalent to cumulative GDP growth of +0.4% between 2021 Q4 and 2023 Q4), into perspective, highlighting just how weak the performance of the UK economy has been over the past two years.

Just as the recession is being described as ‘technical’, there are good arguments for describing positive growth in GDP as also ‘technical’ when per capita growth is negative at the same time, reflecting how much stronger economic growth needs to be for living standards to improve.

This chart was originally published by ICAEW.

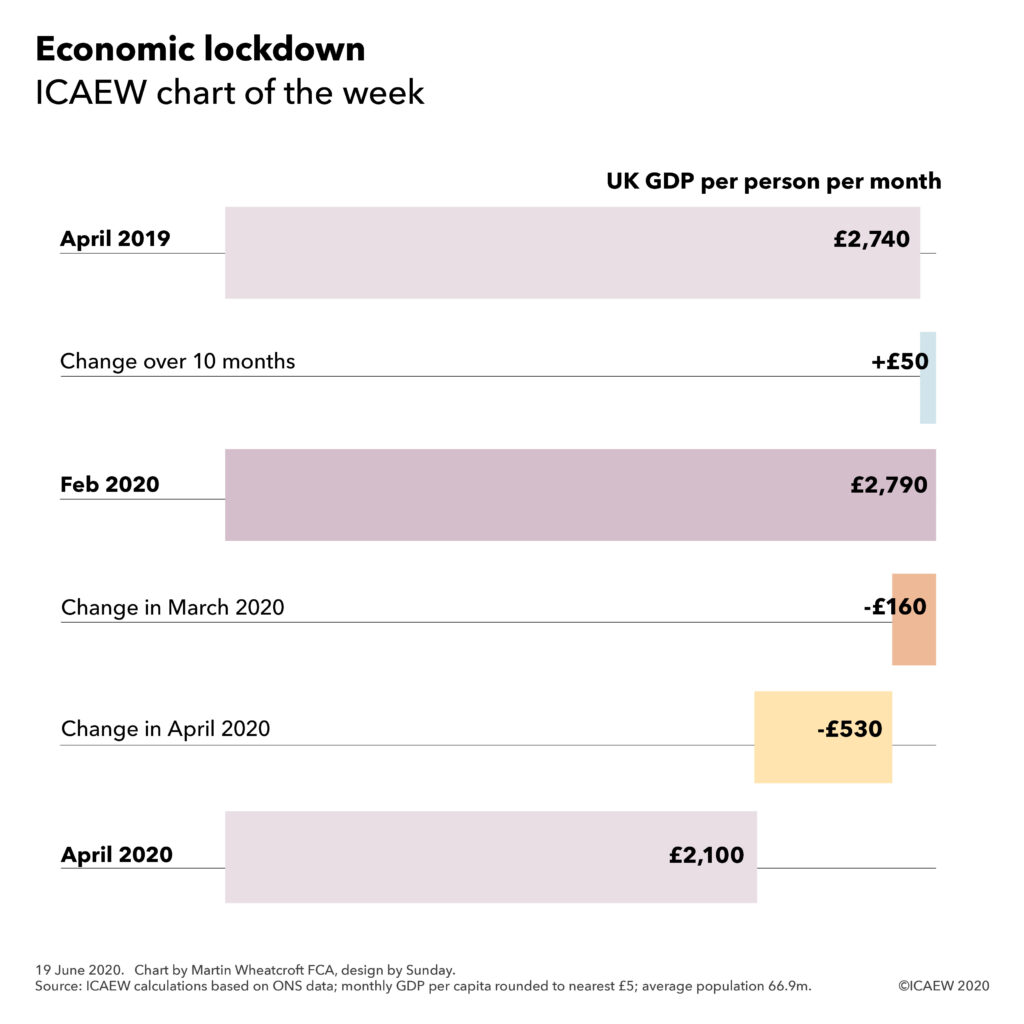
ICAEW chart of the week: Economic lockdown

19 June 2020: Economic contraction sees monthly GDP per capita decline from £2,790 in February 2020 to £2,100 in April 2020.

UK GDP per person per month - April 2019: £2,740 +£50 = Feb 2020: £2,790 - Mar £160 - Apr £530 = April 2020: £2,100.

The #icaewchartoftheweek is on the economy this week, illustrating how average GDP per person per month increased from £2,740 in April 2019 to £2,790 in February 2020, before contracting sharply in March and April.

The increase of £50 per person in economic activity between April 2019 and February 2020 was predominately driven by inflation, with per capita economic growth of less than 0.4% over the 10 month period. This reflects just how weak the UK economy was immediately before the pandemic.

The modest increase up to February 2020 is dwarfed by the dramatic changes seen as a consequence of the pandemic, with severe curtailments in many parts of the economy leading to a 5.8% fall in economic activity in March and a further 20.4% in April according to provisional numbers from the Office for National Statistics.

Monthly GDP was estimated to be £183bn in April 2019, £187bn in February 2020 and £141bn in April 2020. The population was projected to be just over 66.7m in April 2019, rising to 67.0m by February 2020, before increasing very slightly in March prior to the lockdown and then falling a little in April.

The dramatic transformation in the UK economy wrought by the lockdown is now extremely visible in the statistics, but it will take some time for the post-lockdown economic position to emerge in order to be able to see how much permanent damage has been done.

This article was originally published by ICAEW.