Government deficit hits £100bn in the first half of the financial year

Revisions and corrections help reduce the budget overrun to £7bn for the six months to September 2025, but the outlook remains bleak.

The UK government deficit hit £100bn in the six months to September 2025, according to the latest Office for National Statistics’ (ONS) monthly public sector finances release for September 2025, published on 21 October 2025. 

The report also revealed a provisional shortfall between receipts and public spending of £20bn last month. The deficit for the month was £1bn higher than the previous year, in line with the budget. The cumulative deficit was £12bn higher than the first half of 2024/25, and £7bn more than budgeted.

Month of September 2025

Provisional receipts and total public spending for September – £95bn and £115bn respectively – were each 8% more than the previous year.

Current spending included depreciation of £108bn, comparable to the £108bn monthly average in the first five months of the financial year. Net investment was £7bn, higher than the £4bn monthly average investment between April and August 2025.

Excluding net investment, the current budget deficit for the month was £13bn – £2bn more than in the same month last year, £1bn more than budgeted. This was offset by a £1bn underspend on net investment.

Six months to September 2025

The provisional deficit for the six months to September 2025 was £12bn (14%) more than in the same six months last year. This was £7bn higher than budget, which can be analysed as a £13bn budget overrun on the current budget deficit (current receipts less current spending), less a £6bn underspend on net investment.

Table 1 highlights the changes in year-to-date receipts, up 7% overall on last year’s equivalents. These increases were mostly driven by factors such as inflation and fiscal drag from frozen tax allowances. The 20% increase in national insurance revenues reflects the increase in employers’ national insurance.

The 9% increase in current spending over the year has been driven by public sector pay rises, higher supplier costs, and the uprating of welfare benefits.

Net investment of £28bn in the first six months of 2025/26 was £1bn, or 4% higher than the same period last year. Capital expenditure of £46bn was up by £2bn and capital transfers (capital grants, research and development funding, and student loan write-offs) of £18bn were up by £1bn, offset by depreciation of £36bn, up by £2bn.

Table 1  Summary receipts and spending

6 months to Sep2025/26
£bn
2024/25
£bn
Change
%
Income VAT145133+9%
VAT104100+4%
National insurance9882+20%
Corporation tax5248+8%
Other taxes115112+3%
Other receipts6362+2%
Current receipts577537+7%
Public services(363)(334)+9%
Welfare(155)(146+6%
Subsidies(18)(17)+6%
Debt interest(77)(67)+15%
Depreciation(36)(34)+6%
Current spending(649)(598)+9%
Current deficit(72)(61)+18%
Net investment(28)(27)+4%
Deficit(100)(88)+14%

Budget for the rest of the financial year

The deficit is budgeted to be £118bn for the full year ending 31 March 2026, comprising £93bn in the first half of the year to September 2025 and £25bn in the second half of the year.

Borrowing and debt

Table 2 summarises government borrowing in the first six months of the financial year, taking public sector net debt to a provisional £2,916bn on 30 September 2025. This comprised £100bn in public sector net borrowing (PSNB) to fund the deficit and a further £6bn to fund government lending and working capital requirements.

The table also illustrates how the debt-to-GDP ratio increased by 1.6 percentage points, from a revised 93.7% of GDP at the start of the financial year to 95.3% on 30 September 2025, with incremental borrowing of £106bn, equivalent to 3.5% of GDP. It was partly offset by 1.9 percentage points due to inflation and economic growth adding to GDP.

Table 2  Public sector net debt and net debt/GDP

6 months to Sep2025/26
£bn
2024/25
£bn
PSNB10088
Other borrowing6(14)
Net change10674
Opening net debt2,8102,686
Closing net debt2,9162,760
PSNB/GDP3.3%3.1%
Other/GDP0.2%(0.5%)
Inflating away(1.9%)(2.7%)
Net change1.6%(0.1%)
Opening net debt/GDP93.7%94.4%
Closing net debt/GDP95.3%94.3%

Public sector net debt on 30 September 2025 of £2,916bn comprised gross debt of £3,368bn less cash and other liquid financial assets of £452bn. 

Public sector net financial liabilities were £2,565bn, comprising the net debt plus other financial liabilities of £715bn, less illiquid financial assets of £1,066bn. Public sector negative net worth was £908bn – net financial liabilities of £2,565bn less non-financial assets of £1,657bn.

Revisions

Caution is needed with ONS figures, which are repeatedly revised as estimates are refined, and gaps in the underlying data are filled. This includes local government, where numbers are updated in arrears and are based on budget or high-level estimates in the absence of monthly data collection.

This month, the ONS revised down the previously reported deficit for the five months to August 2025 by £4bn, including a £2bn error correction for understated VAT receipts. The ONS also increased the reported deficit for the previous financial year (2024/25) by £4bn to £150bn to incorporate estimates of local government actual expenditure.

More significantly, the ONS revised its methodology for calculating economic activity, resulting in an increase in GDP of 1%. Doing so causes historical percentages for deficit and debt as a proportion of GDP to be revised downwards. This includes a 1.1 percentage reduction in public sector net debt/GDP at the start of the financial year on 1 April 2025, from the previously reported 94.8% to the 93.7% shown in Table 2.  

Martin Wheatcroft, external advisor on public finances to ICAEW, said that public finances were broadly as expected, with the £20bn deficit for the month in line with budget.

“Borrowing to fund the deficit was a fraction under £100bn in the six months to September, the second-highest half-year deficit on record after the pandemic year. This was despite a narrowing of the year-to-date budget overrun to £7bn, as a consequence of error corrections and other revisions to previous months. In addition, statistical revisions to the size of the economy resulted in around a percentage point fall in the ratio of public sector net debt to GDP.”

Tepid economic growth and high debt interest costs will continue to weigh on prospects for the rest of the financial year, he added. “The revisions do very little to alter the bleak outlook for the public finances that is driving the need for a significant fiscal correction in the Autumn Budget 2025.”

This article was written by Martin Wheatcroft for ICAEW and was originally published by ICAEW.
Public finances turn ugly just as Chancellor needs good news

Weaker receipts than expected combined with prior month corrections resulted in a £12bn year-to-date budget overrun in the August monthly public finances.

The monthly public sector finances release for August 2025 published by the Office for National Statistics (ONS) on 19 September reported a provisional shortfall between receipts and total public spending of £18bn in August 2025 and £84bn for the five months then ended. These were £6bn and £12bn over budget respectively and £4bn and £16bn higher than in the same periods in 2024.

Martin Wheatcroft, external adviser on public finances to ICAEW, says: “This month’s public finance numbers took a turn for the worse as not only did weaker than expected receipts drive a £6bn budget overrun in August, but revisions to prior months added a further £6bn to the deficit to turn a broadly neutral position a month ago into a £12bn year-to-date budget overrun for the first five months of the 2025/26 financial year.

“These numbers are far from helpful to a Chancellor in desperate need of some good financial news, adding to the prospect of even higher tax rises in the Autumn Budget 2025 than previously feared.”

Month of August 2025

Receipts of £93bn in August 2025 were £5bn or 5% higher than the same month last year, while total public spending was £111bn, £8bn or 8% more than in August 2024. The latter can be analysed between current spending including depreciation of £107bn, slightly below the £108bn monthly average in the first four months of the financial year, and net investment of £4bn, in line with the monthly average incurred between April and July 2025.

Excluding net investment, the current budget deficit for the month of £14bn represented a £4bn deterioration over the current budget deficit of £10bn in the same month last year, highlighting how receipts have failed to keep pace with increases in current spending.

The overall £18bn fiscal deficit for the month was £6bn over budget and £4bn more than in August 2024.

Five months to August 2025

Table 1 highlights how year-to-date receipts of £477bn were up 6% on last year’s equivalents. This included income tax receipts, up 8% from a combination of inflation and fiscal drag from frozen tax allowances, and national insurance receipts, up 18% as a consequence of the increase in employer national insurance from April 2025. VAT receipts were flat year-on-year, in effect a 3% to 4% fall after taking account of consumer price inflation, highlighting the weak economic conditions facing the UK.

Meanwhile, the 8% increase over last year in current spending including depreciation to £539bn in the first five months to August 2025 has principally been driven by public sector pay rises, higher supplier costs, and the uprating of welfare benefits.

This included a £7bn or 12% increase in debt interest to £64bn, which comprised a £6bn increase in indexation on inflation-linked debt as inflation resurged and a £1bn increase in interest on variable and fixed-interest debt. The latter reflects a higher level of debt compared with a year ago being partially offset by a lower Bank of England base rate.

The resulting current budget deficit of £62bn to August 2025 was 29% higher than the £48bn for the same five months last year, a major concern given that the government’s plan was to reduce the cumulative current budget deficit to £47bn at this point.

Net investment of £22bn in the first five months of 2025/26 was £2bn or 10% higher than the same period last year with capital expenditure of £39bn up by £3bn and capital transfers (capital grants, research and development funding, and student loan write-offs) of £13bn up by £1bn, offset by depreciation of £30bn up by £2bn.

The overall provisional deficit for the five months to August 2025 of £84bn is £16bn or 24% more than in the same five months last year and £12bn higher than budget. The latter can be analysed as a £15bn budget overrun on current receipts less current spending for the year-to-date, less a £3bn saving on net investment.

Table 1: Summary receipts and spending

5 months to Aug2025/26
£bn
2024/25
£bn
Change
%
Income tax122113+8%
VAT8484
National insurance8068+18%
Corporation tax4340+7%
Other taxes9693+3%
Other receipts5251+2%
Current receipts477449+6%
    
Public services(301)(276)+9%
Welfare(129)(122)+6%
Subsidies(15)(14)+7%
Debt interest(64)(57)+12%
Depreciation(30)(28)+7%
Current spending(539)(497)+8%
Current deficit(62)(48)+29%
Net investment(22)(20)+10%
Deficit(84)(68)+24%

Borrowing and debt

Table 2 summarises how the government borrowed £99bn in the first five months of the financial year to take public sector net debt to a provisional £2,909bn on 31 August 2025. This comprised £84bn in public sector net borrowing (PSNB) to fund the deficit and a further £15bn to fund government lending and working capital requirements.

The table also illustrates how the debt to GDP ratio increased by 1.6 percentage points from 94.8% of GDP at the start of the financial year to 96.4% on 31 August 2025, with incremental borrowing of £99bn, equivalent to 3.3% of GDP, being partly offset by 1.7 percentage points from the ‘inflating away’ effect of inflation and economic growth adding to GDP, the denominator in the net debt to GDP ratio.

Table 2: Public sector net debt and net debt/GDP

5 months to Aug2025/26
£
bn
2024/25
£
bn
PSNB8468
Other borrowing157
Net change9975
Opening net debt2,8102,686
Closing net debt2,9092,761
   
PSNB/GDP2.8%2.4%
Other/GDP0.5%0.2%
Inflating away(1.7%)(2.3%)
Net change1.6%0.3%
Opening net debt/GDP94.8%95.6%
Closing net debt/GDP96.4%95.9%

Public sector net debt on 31 August 2025 of £2,909bn comprised gross debt of £3,339bn less cash and other liquid financial assets of £430bn. 

Public sector net financial liabilities were £2,550bn, comprising net debt of £2,909bn plus other financial liabilities of £715bn less illiquid financial assets of £1,074bn. 

Public sector negative net worth was £893bn, being net financial liabilities of £2,550bn less non-financial assets of £1,657bn.

Revisions

Caution is needed with respect to the numbers published by the ONS, which are repeatedly revised as estimates are refined and gaps in the underlying data are filled. This includes local government, where the numbers are only updated in arrears and are based on budget or high-level estimates in the absence of monthly data collection.

This month was no different, with the ONS revising the previously reported deficit for the four months to July 2025 up by £6bn, as well as updating prior year numbers for the annual results of the Bank of England and several other public bodies as well as other typical annual updates such as revised student loan calculations. 

More significantly, the ONS revised reported deficits back to 1998 for methodology and classification changes and back to 2011 for local government outturn numbers that had not previously been incorporated. The reported deficits for 2020/21 and 2021/22 were decreased by £3bn and £2bn to £311bn and £120bn respectively, 2022/23 remained unchanged at £127bn, 2023/24 was increased by £2bn to £134bn, and 2024/25 was reduced by £2bn to £146bn.

This article was written by Martin Wheatcroft for ICAEW and was originally published by ICAEW.
Little comfort for Chancellor as public finances stay in line

Borrowing to fund the deficit in the first four months of the financial year of £60bn was in line with expectations.

The monthly public sector finances release for July 2025 published by the Office for National Statistics (ONS) on 21 August reported a provisional shortfall between receipts and total public spending of £60bn for the four months ended 31 July 2025. This is in line with budget and £7bn more than in the same period last year.

Martin Wheatcroft, External Adviser on Public Finances to ICAEW, says: “This month’s ‘not bad’ result may provide a small amount of relief to a Chancellor under significant pressure.

“The monthly deficit for July was slightly better than expected, while the cumulative result for the first third of the financial year was almost exactly in line with the Office for Budget Responsibility’s prediction at the time of the Spring Statement 2025.

“Unfortunately, this does not change the dismal outlook for the public finances and the rising costs of public services, welfare provision and debt interest that means the Chancellor is again having to work out how she can ask Parliament to authorise higher levels of taxation.”

Month of July 2025

Receipts of £108.8bn in July 2025 were £9.2bn or 9% higher than in July 2024 and also higher than the £92.6bn average for the first three months of the financial year, principally as a result of a boost from income tax self-assessment collections in the month.

Meanwhile, current spending including depreciation of £105.5bn in July was £6.0bn or 6% more than in the same month a year previously. This was slightly lower than the £108.0bn monthly average incurred during April to June 2025.

The result was a current budget surplus for the month of £3.3bn, a £3.2bn improvement over the current budget surplus of £0.1bn in the same month last year.

Net investment of £4.4bn in July 2025 was £0.9bn more than the £3.5bn incurred in July 2024 and slightly higher than the £4.2bn average incurred during the three months to June 2025.

The provisional fiscal deficit for July 2025 was therefore £1.1bn, £1.0bn less than the £2.1bn budget for the month and a £2.3bn improvement over the £3.4bn deficit in July 2024.

Four months to July 2025

Table 1 highlights how year-to-date receipts of £387bn were up 7% on last year’s equivalents, with income tax receipts up 8% from a combination of inflation and fiscal drag from frozen tax allowances, and national insurance receipts up 19% as a consequence of the increase in employer national insurance that was implemented in April 2025.

Meanwhile, the 8% increase over last year in current spending including depreciation to £430bn in the first four months to July 2025 was primarily as a consequence of public sector pay rises, higher supplier costs, and the uprating of welfare benefits.

This included a £6bn or 13% increase in debt interest to £53bn, which comprised a £5bn increase in indexation on inflation-linked debt as inflation resurged and a £1bn increase in interest on variable and fixed-interest debt. The latter was primarily the result of a higher level of debt compared with a year ago partially offset by a lower Bank of England base rate.

The resulting current budget deficit of £43bn to July 2025 was 16% higher than for the same four months last year.

Net investment of £17bn in the first four months of 2025/26 was £1bn or 6% higher than the same period last year. Capital expenditure of £30bn was up by £1bn and capital transfers (capital grants, research and development funding, and student loan write-offs) of £11bn were up by £2bn, less depreciation of £24bn that was up by £2bn compared with the same four month period a year prior.

The consequence is a provisional deficit for the first third of the 2025/26 financial year of £60bn, which is £7bn or 13% more than in the same four month period last year. Despite being almost exactly in line with budget (only £0.1bn higher) this is the third-highest April-to-July deficit since monthly records began in 1993 (after 2020/21 and 2021/22 during the pandemic).

Table 1: Summary receipts and spending

4 months to July2025/26
£bn
2024/25
£bn
Change
%
Income tax10093+8%
VAT7067+4%
National insurance6454+19%
Corporation tax3532+9%
Other taxes7674+3%
Other receipts4241+2%
Current receipts387361+7%
    
Public services(239)(221)+8%
Welfare(103)(97)+6%
Subsidies(11)(11)
Debt interest(53)(47)+13%
Depreciation(24)(22)+9%
Current spending(430)(398)+8%
Current deficit(43)(37)+16%
Net investment(17)(16)+6%
Deficit(60)(53)+13%

Borrowing and debt

Table 2 summarises how the government borrowed £81bn in the first third of the financial year to take public sector net debt to a provisional £2,891bn on 31 July 2025. This comprised £60bn in public sector net borrowing (PSNB) to fund the deficit and £21bn to fund government lending activities and working capital movements.

The table also illustrates how the debt to GDP ratio increased from 94.8% of GDP at the start of the financial year to 96.1% on 31 July 2025, with the incremental borrowing partly offset by the ‘inflating away’ effect of inflation and economic growth adding to GDP, the denominator in the net debt to GDP ratio.

Table 2: Public sector net debt and net debt/GDP

4 months to July2025/26
£bn
2024/25
£bn
PSNB6053
Other borrowing21(1)
Net change8152
Opening net debt2,8102,686
Closing net debt2,8912,738
   
PSNB/GDP2.1%1.9%
Other/GDP0.7%
Inflating away(1.5%)(1.9%)
Net change1.3%
Opening net debt/GDP94.8%95.6%
Closing net debt/GDP96.1%95.6%

Public sector net debt on 31 July 2025 of £2,891bn comprised gross debt of £3,309bn less cash and other liquid financial assets of £418bn.

Public sector net financial liabilities were £2,525bn, comprising net debt of £2,891bn plus other financial liabilities of £707bn less illiquid financial assets of £1,073bn. Public sector negative net worth was £899bn, being net financial liabilities of £2,525bn less non-financial assets of £1,626bn.

Revisions

Caution is needed with respect to the numbers published by the ONS, which are repeatedly revised as estimates are refined and gaps in the underlying data are filled. This includes local government, where the numbers are only updated in arrears and are based on budget or high-level estimates in the absence of monthly data collection.

The latest release saw the ONS revise the previously reported deficit for the three months to June 2025 up by £1bn. The ONS also revised up its estimate of GDP in the first quarter of the financial year, resulting in a 0.4 reduction in the opening debt to GDP ratio on 1 April 2025 from 95.2% to 94.8% and the debt to GDP ratio for 30 June 2025 from 96.2% to 95.8%.

This article was written by Martin Wheatcroft FCA on behalf of ICAEW and was originally published by ICAEW.
ICAEW chart of the week: UK registered businesses

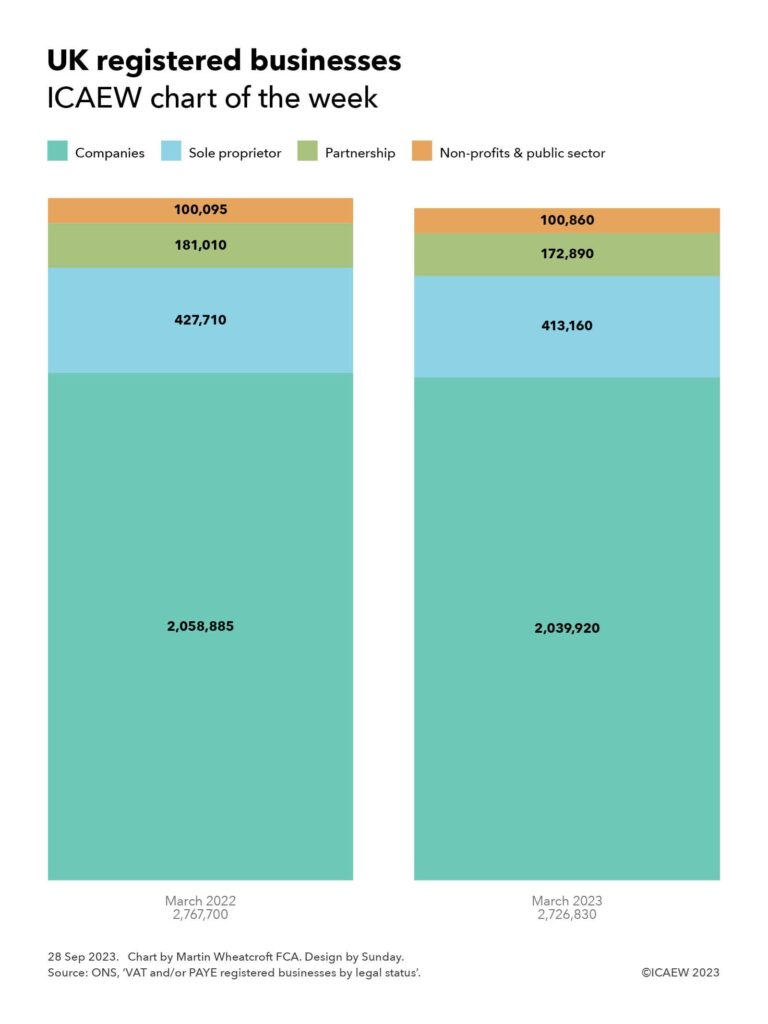
My chart this week looks at the 1.5% drop in the number of VAT- and PAYE-registered businesses in the year to 31 March 2023.

Column chart with two columns for March 2022 (left) and March 2023 (right).

Total registered businesses - 2,767,700 (March 2022) and 2,726,830 (March 2023).

Companies - 2,058,886 and 2,039,920

Sole proprietors - 427,710 and 413,160

Partnerships - 181,010 and 172,890

Non-profits & public sector - 100,095 and 100,860.

On 27 September 2023, the Office for National Statistics (ONS) published data on the 2,726,830 businesses that were registered for VAT and/or PAYE in the UK as of March 2023, a 1.5% fall from the 2,767,700 businesses that were registered a year previously. 

As illustrated by our chart this week, the number of VAT- and PAYE-registered companies fell by 0.9% from 2,058,885 to 2,039,920, sole proprietorships fell by 3.4% from 427,710 to 413,160, and partnerships fell by 4.5% from 181,010 to 172,890. 

Bucking the trend were non-profit bodies, mutual associations and public sector organisations, which rose by 0.8% from 100,095 to 100,860. The latter comprised 88,375 non-profit bodies and mutuals, 9,030 local authority entities, 3,280 central government entities and 175 public corporations and other publicly owned businesses, as of March 2023.

Not shown in the chart are in the order of 2.8m ‘unregistered’ businesses that are not registered for VAT or PAYE. Most of these are self-employed individuals, sole traders, or one-person companies that generate revenue below the VAT threshold of £85,000 and do not have any payrolled employees.

The number of registered businesses in March 2023 by industry group are comprised as follows: 

  • 415,250 professional, scientific and technical (down 3.7% on March 2022); 
  • 402,165 motor trades (-2.8%); 
  • 377,585 construction (+0.7%);
  • 226,285 business administration and support services (-1.1%); 
  • 187,360 information and communication (-4.5%); 
  • 184,420 arts, entertainment, recreation and other services (+2.0%);
  • 174,830 accommodation and food services (-0.2%); 
  • 151,710 production (-1.8%);
  • 141,390 agriculture, forestry and fishing (-0.8%)
  • 128,600 transport and storage including postal (-6.9%);
  • 113,785 (+2.8%) property, 109,095 health (+2.8%);
  • 59,210 finance and insurance (-2.0%);
  • 47,340 education (+1.3%); and
  • 7,805 public administration and defence (+0.4%).

There were 2,115,105 businesses with between zero and four employees as of March 2023, followed by 313,780 (five to nine employees), 157,955 (10-19), 86,285 (20-49), 27,660 (50-99). 15,135 (100-249) and 10,910 (250+).

By turnover band, the numbers as of March 2023 were: 445,020 (£0-£49,999); 563,610 (£50,000-£99,999); 846,615 (£100,000-£249,999); 367,315 (£250,000-£499,999); 222,155 (£500,000-£999,999); 123,995 (£1m-£2m); 85,655 (£2m-£5m); 32,100 (£5m-£10m); 29,080 (£10m-£50m); and 9,285 (£50m+).

The fall in the number of businesses in 2022/23 is perhaps not surprising given the significant amount of support provided to many businesses during the pandemic, which will have delayed the normal process of business closure during the previous two years. Meanwhile, the cost-of-living and energy crises will have also made it difficult for some businesses to survive in the year to March 2023. Even though energy prices have come down, the cost-of-living crisis and consequent reductions in consumer demand could see further businesses fail during 2023/24.

Find out more: ONS: UK business – activity, size and location 2023.

This chart was originally published by ICAEW.

ICAEW chart of the week: VAT threshold

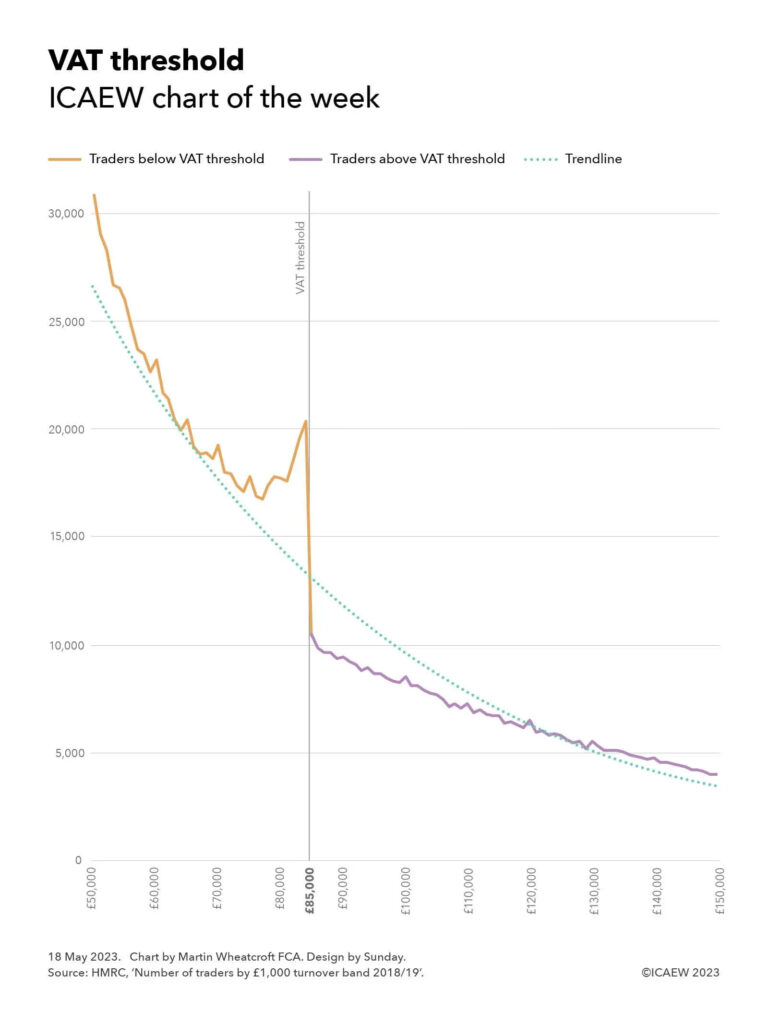
The mystery of just why so many businesses sit just below the VAT registration threshold will be a big topic of debate at ICAEW’s VAT at 50 conference on Monday 22 May.

Line chart showing number of businesses plotted against £1,000 turnover intervals.

An orange line shows how the number of traders curves down as turnover increases, before increasing sharply before the VAT threshold (a vertical line in the chart at £85,000) and dropping almost vertically. 

A purple line shows a relatively straight decline to the right of the VAT threshold, with some bumps along the way.

A teal-coloured dotted trendline curves through the chart, with  businesses all above the trendline to the left of the VAT threshold, and below the trendline to the right up until £130,000.

Our chart this week celebrates the 50th anniversary of the introduction in the UK of Value Added Tax (VAT), the indirect tax on commercial transactions that now generates around 20% of tax receipts. 

One of the big mysteries in the tax system is why so many small businesses and sole traders cluster just below the VAT threshold of £85,000.

As illustrated by our chart, the number of businesses below the threshold gradually falls from almost 31,000 in the turnover band between £50,000 and £50,999 to just under 17,000 in the turnover band between £77,000 and £77,999, before diverging above the trendline to increase up to just over 20,000 in the £84,000 to £84,999 turnover band – immediately below the threshold for registering for VAT. This is almost twice as many as the just over 10,000 traders in the £85,000 to £85,999 turnover band, the first band legally required to register for VAT. 

One explanation may be that there is some gaming (or possibly even misreporting) going on, with business owners approaching the threshold for VAT deciding to spread their business activities across multiple legal entities or keeping ‘cash-in-hand’ transactions off the books to avoid, or evade, adding VAT of 20% in most cases onto their prices.

However, perhaps a more worrying concern is if these businesses are not getting around the rules, but instead deliberately choosing to keep their businesses small given the competitive disadvantage that goes with adding VAT to prices charged to consumers, and the hassles and hazards involved with becoming a tax collector on behalf of the government. 

This is a big issue for a UK economy experiencing weak economic growth. Not only is government income at stake, but also the wider benefits of more prosperous small businesses to the overall economy and what that means for the national economy.

Of course, many businesses do register despite being below the threshold, with around 1.1m traders in 2018/19 with turnover less than £85,000 signed up to VAT.

Other countries take a different approach, with much lower registration thresholds across most of Europe. Domestic thresholds range from nil in Spain, Italy and Greece, NOK40,000 (approximately £3,000) in Norway, €22,000 (£19,000) in Germany and €37,500 (£33,000) in Ireland, up to €50,000 (£43,000) in Slovenia. Switzerland is an exception with a higher registration threshold than the UK at CHF100,000 (£89,000). 

In general, this means that a much greater proportion of actively trading businesses across Europe are registered for VAT compared with the UK, where there are estimated to be more than 3m or so traders with annual revenue of between £10,000 and £84,999 who have not registered for VAT – more than £100bn in total revenue.

Some believe that raising the threshold would provide a boost to the economy, given that many businesses would be more willing to grow (or declare) more of their revenue, while others believe the better option would be to reduce the threshold to capture many more businesses. The former would likely result in lower tax receipts overall, by allowing businesses just above the existing threshold to stop collecting VAT. The latter should in theory generate much more in tax receipts, perhaps as much as £20bn a year, in addition to removing one of the distortions that the tax system creates in this part of the economy.

The irony is that a relatively high VAT threshold in the UK designed to encourage and support small businesses may be one of the factors holding back economic growth. And with an unchanged threshold combined with inflation of more than 10% over the past year, this may be an even bigger drag on the economy/incentive to cheat than it has been in the past.

Click here to find out more about VAT at 50, ICAEW’s celebration (if that is the right word) of the 50th anniversary of VAT, and what the future holds for our most beloved of indirect taxes.

This chart was originally published by ICAEW.

ICAEW chart of the week: UK business births and deaths

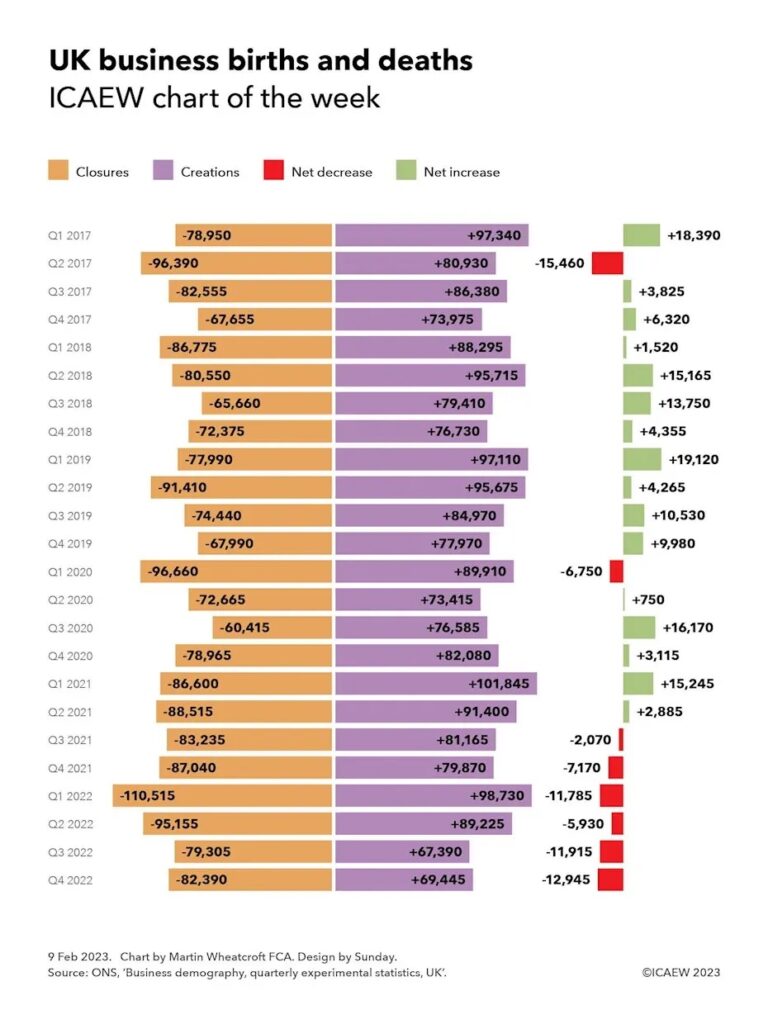
My chart this week illustrates the choppy economic waters facing UK businesses as more stopped trading than were created over the course of 2022.

Bar chart going down vertically from Q1 2017 to Q4 2022 showing business closures and creations on the left and the net decrease or net increase on the right.

Q1 2017 -78,950, +97,340, +18,390
Q2 2017 -96,390, +80,930, -15,460
Q3 2017 -82,555, +86,380, +3,825
Q4 2017 -67,655, -73,975, +6,320
Q1 2018 -86,775, +88,295, +1,520
Q2 2018 -80,550, +95,715, +15,165
Q3 2018 -65,660, +79,410, +13,750
Q4 2018 -72,375, +76,730, +4,355
Q1 2019 -77,990, +97,110, +19,120
Q2 2019 -91,410, +95,675, +4,265
Q3 2019 -74,440, +84,970, +10,530
Q4 2019 -67,990, +77,970, +9,980
Q1 2020 -96,660, +89,910, -6,750
Q2 2020 -72,665, +73,415, +16,170
Q3 2020 -60,415, +76,585, +16,170
Q4 2020 -78,965, +82,080, +3,115
Q1 2021 -86,600, +101,845, +15,245
Q2 2021 -88,515, +91,400, +2,885
Q3 2021 -83,235, +81,165, -2,070
Q4 2021 -87,040, +79,870, -7,170
Q1 2022 -110,515, +98,730, -11,785
Q2 2022 95,155, +89,225, -5,930
Q3 2022 -79,305, +67,390, -11,915
Q4 2022 -82,390, -69,445, -12,945

The Office for National Statistics (ONS) published its latest quarterly experimental statistics on business births and deaths on 2 February 2023. This reports that business closures have increased since before the pandemic at the same time as business creations have fallen, resulting in net reductions in the number of VAT- or PAYE-registered businesses operating in the UK over the past six quarters.

The statistics are taken from the government’s Inter-Departmental Business Register, a database of approximately 2.8m businesses registered for either PAYE or VAT, just over half of the estimated 5.5m businesses operating in the UK (according to the Department of Business & Trade). The difference principally relates to sole traders with turnover below the VAT threshold who have not voluntarily registered for VAT, or for PAYE if they trade through a company. There is also a time lag on reporting the closure of businesses where a business continues to be registered, with the ONS waiting for several periods of zero VAT or zero payrolls before recording a business as closed.

The statistics are labelled as experimental because they are not as rigorous as annual statistics, but the advantage is that they provide data on business births and deaths in 2022, for which we will not get a full set of annual numbers until towards the end of this year. 

As our chart illustrates, the quarterly net change in businesses in 2017 was +18,390, -15,460, +3,825 and +6,320 respectively, followed by +1,520, +15,165, +13,750, +4,365 in 2018, +19,120 and +4,265, +10,530 and +9,980 in 2019. The pandemic saw a fall in business closures as government support enabled businesses that would otherwise have stopped operating to stay alive, with a net decrease of -6,750 in Q1 2020 followed by net increases of +750, +16,170, +3,115 in the second, third and fourth quarters of 2020. 

A spurt in business creations in early 2021 saw net increases of +15,245 and +2,885 in the first two quarters, before net decreases of -2,070 and 7,170 in the last two quarters of 2021. With pandemic support measures coming to an end and the onset of the energy crisis, the trend moved further into negative territory with quarterly net closures of -11,785, -5,930, -11,915 and -12,945 in 2022.

Quarterly business deaths averaged around 81,400 in 2017, 76,300 in 2018, 78,000 in 2019, 77,200 in 2020, 86,300 in 2021 and 91,800 in 2022, while quarterly business births averaged around 84,700 in 2017, 85,000 in 2018, 88,900 in 2019, 80,500 in 2020, 88,600 in 2021 and 81,200 in 2022.

These numbers will not be pretty reading for Kemi Badenoch, the new Secretary of State for Business and Trade. With interest rates on the rise, energy costs still at very high levels and consumers cutting back on spending, the risks are that many more existing businesses will cease trading, while business creations may continue to be subdued.

One crumb of comfort is that businesses founded during downturns are believed to do better than those founded in good times. So, if you are thinking of striking out on your own with a new business idea, there may be no better time than now.

This chart was originally published by ICAEW.

ICAEW chart of the week: VAT receipts by quarter

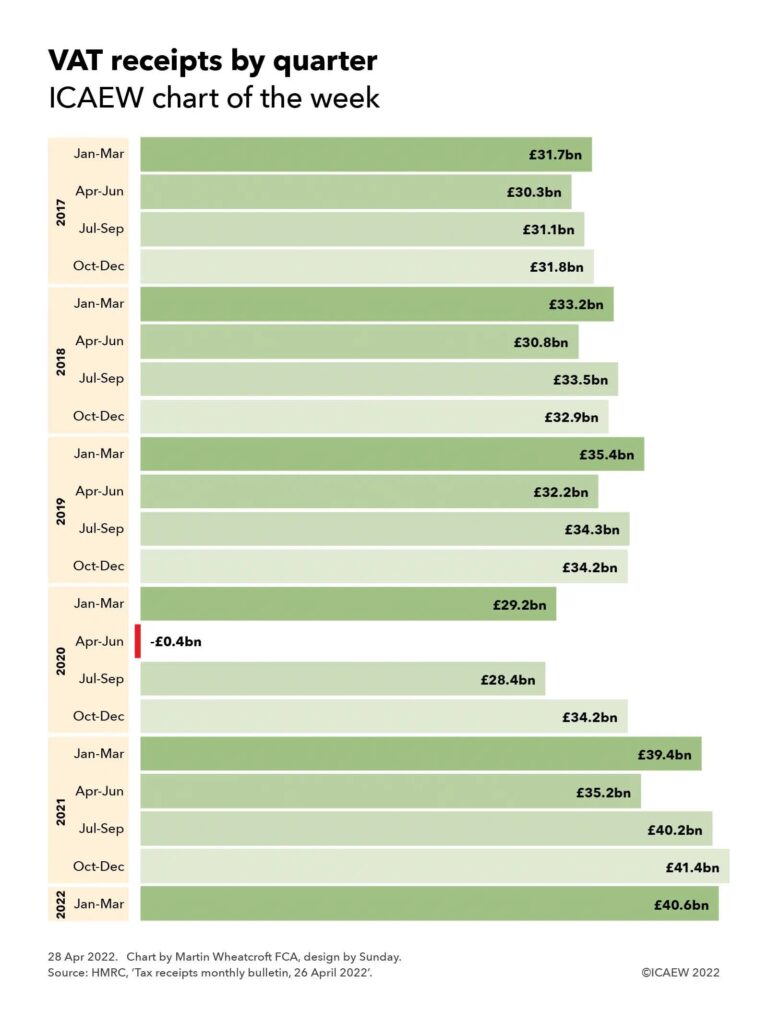
This week’s chart highlights how the VAT deferral scheme is almost entirely behind higher VAT receipts in recent quarters, providing a note of caution to recent media headlines welcoming bumper tax revenues.

Horizontal bar chart showing VAT receipts by quarter from Jan-Mar 2017 through to Jan-Mar 2022.

2017: £31.7bn, £30.3bn, £31.1bn,  £31.8bn (Oct-Dec)
2018: £33.2bn, £30.8bn, £33.5bn, £32.9bn
2019: £35.4bn, £32.2bn, £34.3bn, £34.2bn
2020: £29.2bn, -£0.4bn, £28.4bn, £34.2bn
2021: £39.4bn, £35.2bn, £40.2bn, £41.4bn
2022 Jan-Mar: £40.6bn

The ICAEW chart of the week is on the topic of VAT, illustrating the quarterly pattern of VAT receipts since 2017 according to the HMRC tax receipts and national insurance contributions monthly bulletin published on 26 April.

The chart highlights how VAT receipts have grown steadily since 2017 up until the start of the pandemic, with receipts in calendar quarters of £31.7bn (Jan-Mar), £30.3bn (Apr-Jun), £31.1bn (Jul-Sep) and £31.8bn (Oct-Dec) in 2017; £33.2bn, £30.8bn, £33.5bn and £32.9bn in 2018; and £35.4bn, £32.2bn, £34.3bn and £34.2bn in 2019. This was followed by a big dip in 2020, with £29.2bn in Jan-Mar 2020, a net negative outflow of -£0.4bn in Apr-Jun, £28.4bn in Jul-Sep and £34.2bn in Oct-Dec 2020. In 2021, VAT receipts strengthened, with £39.4bn, £35.2bn, £40.2bn and £41.4bn by quarter, followed by £40.6bn in Jan-Mar 2022, the last quarter of the 2021/22 fiscal year.

The significant drop in VAT receipts in 2020 was driven by a combination of the economic contraction caused by the pandemic, cuts in VAT rates for hospitality, and – most significantly – £33.5bn in deferrals under the VAT payments deferral scheme implemented at the time of the first lockdown in 2020. This is the primary driver of the negative VAT receipts in the Apr-Jun quarter 2020 highlighted in the chart.

The original intention was that VAT deferred from 2020 would be due by no later than 30 June 2021, however, further relief in the form of a monthly instalment plan allowed VAT-registered businesses to spread the payment of the deferred VAT over the rest of the 2021/22 fiscal year. This has boosted the last three quarters of VAT receipts shown in the chart.

HMRC reports that £31.3bn of the VAT deferred was carried forward in 2021/22, which would imply a swing between financial years in the order of £60bn. This is greater than the £56bn increase in VAT receipts seen between the £101bn recorded for the four quarters to March 2021 and the £157bn in the following four quarters constituting the 2021/22 fiscal year.

VAT receipts excluding the effect of the deferral scheme may therefore have decreased in the last four quarters, which is surprising in the context of rising prices and the end of the discounted VAT rate for hospitality.

Recent media headlines reporting a bumper tax windfall for the Chancellor should therefore be treated with some caution. While tax receipts in 2021/22 have been much stronger than expected, a significant element of the increase relates to the collection of VAT held over from the previous year and not to any genuine increase in underlying tax revenues.

This chart was originally published by ICAEW.