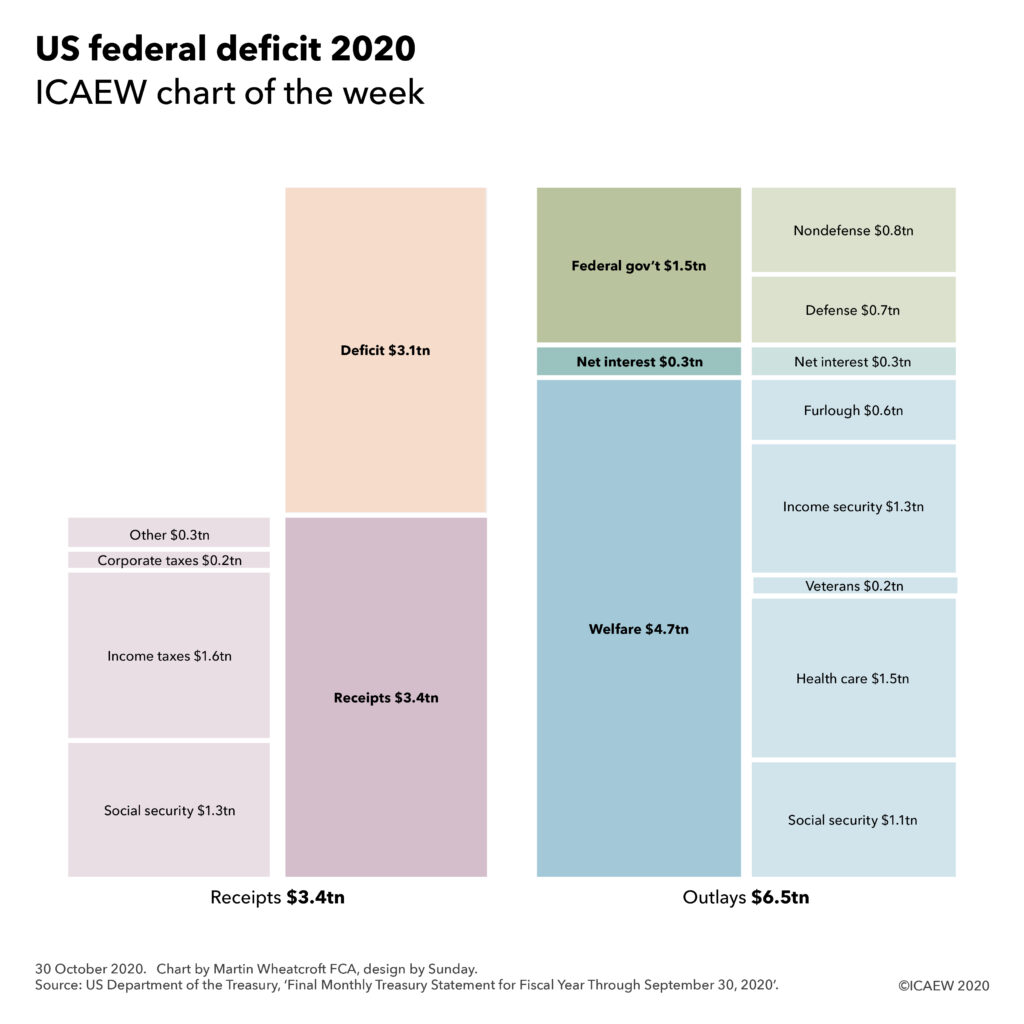
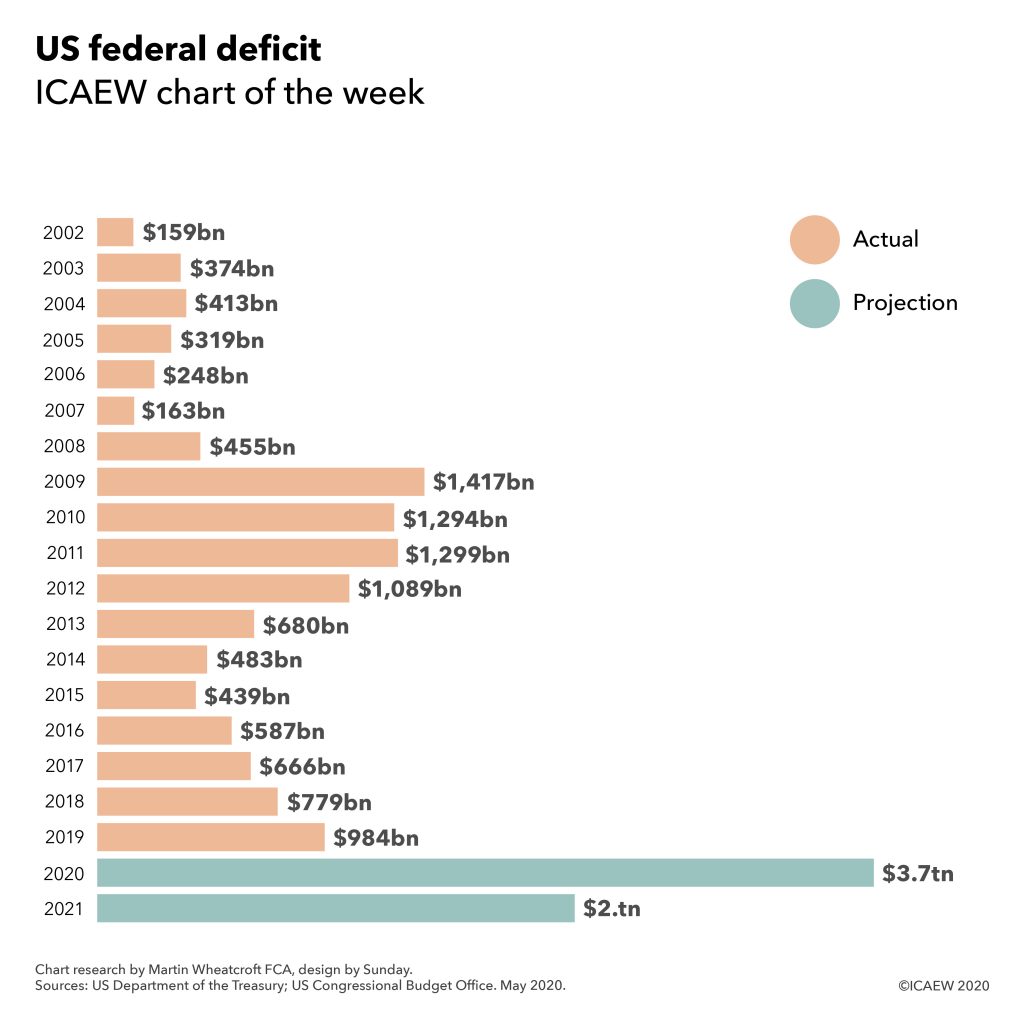
30 October 2020: The US federal government spent $3.1tn more than it received in the year to 30 September 2020, more than three times the $1.0tn deficit incurred in 2019.

The #icaewchartoftheweek is on the $3.1tn deficit incurred by the United States federal government, according to its preliminary financial results for the 2020 fiscal year published by the Bureau of the Fiscal Service, a unit of the US Department of the Treasury.
Analysis by the US Congressional Budget Office reports that receipts of $3.4tn were 1% lower than in the previous financial year, which can broadly be split into a 6% increase in the first half from October 2019 to March 2020 and a 7% decrease in the second half of the year ending in September.
As illustrated by the chart, the principal sources of revenue are $1.3tn in social security payroll tax deductions and $1.6tn in personal income taxes, together with $0.2tn in corporate income taxes and $0.3tn from excise taxes, customs duties, estate and gift taxes and other net receipts.
Outlays of $6.5tn in FY2020 were $2.1tn or 47% higher than in the FY2019, reflecting a 7% increase in the first half and an 87% increase in the second half. These increases were principally driven by the fiscal response to the coronavirus pandemic, including $0.6tn for small business furlough programmes, a $0.4tn increase in unemployment compensation, $0.3tn more in refundable tax credits, $0.2tn in emergency health measures and over $0.1tn for the Coronavirus Relief Fund. Other increases included $0.1tn in student loan subsidies, $0.3tn in federal reserve investments and $0.2tn in other increases, offset by a $0.1tn reduction in interest costs.
Outlays can broadly be split between $4.7tn of ‘mandatory’ spending on welfare, $0.3tn in interest costs and $1.5tn in ‘discretionary’ spending by the federal government.
Welfare comprises spending on social security (principally pensions), Medicare and Medicaid (healthcare), veterans, income security (unemployment benefits and tax credits) and the Paycheck Protection Program for small businesses, while spending on the federal government is dominated by the $0.7tn spent on defence, followed by $0.2tn on education, $0.1tn on homeland security and justice, $0.1tn on transport and $0.4tn on everything else.
It is important to stress that these receipts and outlays relate only to the federal government and exclude what is normally in the region of $3tn in receipts and spending of state and local governments across the US. There is usually a surplus at the state and local level but this year is likely to be different as state and local tax revenues collapse and spending to tackle the pandemic locally continues to grow.
External public debt was $21.0tn at 30 September 2020, an increase of $4.2tn or 25% over the $16.8tn the US federal government owed a year previously, reflecting borrowing to fund the $3.1tn deficit and a net $1.1tn in lending, principally to businesses as part of the coronavirus response.
Even more borrowing is probable irrespective of which candidate wins the presidential election next week as the US struggles to get the pandemic under control and the increasing likelihood that Congress will pass a multi-trillion dollar stimulus bill after the election is over.
