ICAEW chart of the week: Business growth

Our chart this week asks whether the recent low rate of growth in numbers of businesses registered for PAYE and VAT is linked to the increasing difficulty of doing business in the UK.
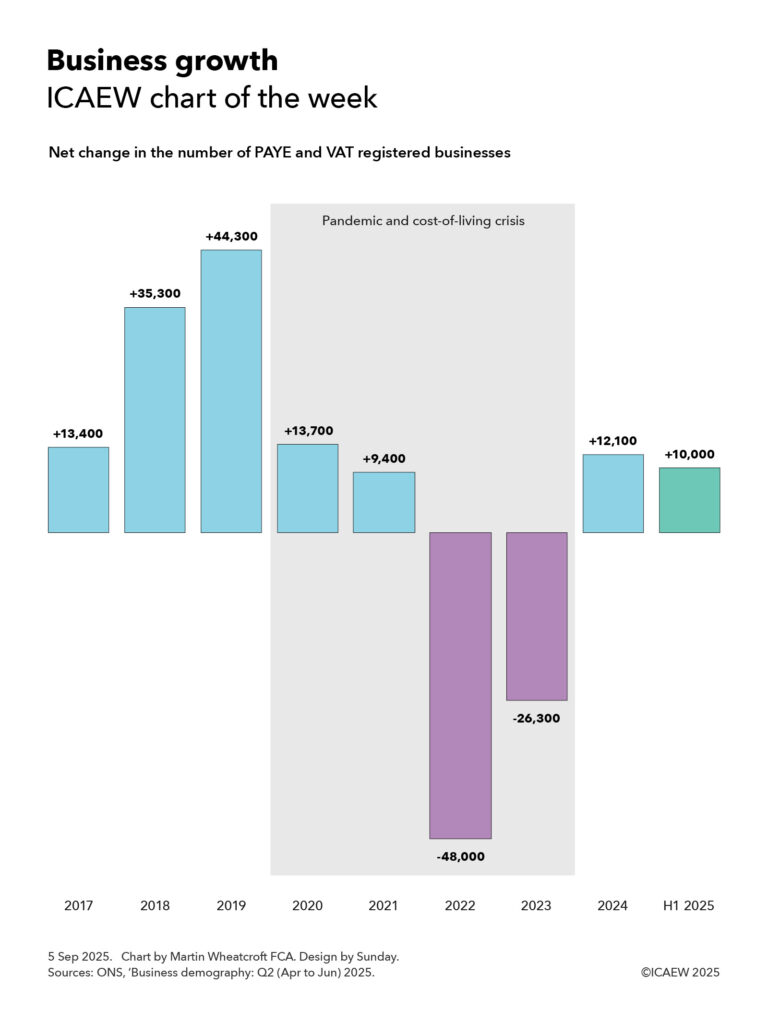
ICAEW chart of the week on business growth, showing the net change in the number of PAYE and VAT registered businesses by year. 

2017: +13,400 
2018: +35,300 
2019: +44,300 
2020: +13,700 
2021: +9,400 
2022: -48,000 
2023: -26,300 
2024: +12,100 
H1 2025: +10,000 

5 Sep 2025. Chart by Martin Wheatcroft FCA. Source: ONS, 'Business demography: Q2 (Apr to Jun) 2025.

According to the Office for National Statistics, there were net additions of approximately 13,400, 35,300 and 44,300 to the UK inter-departmental business register in 2017, 2018 and 2019 respectively. This was followed by net additions of 13,700 and 9,400 in 2020 and 2021 during the pandemic and then net reductions of 48,000 and 26,300 in 2022 and 2023 during the cost-of-living crisis.

The register started growing again in 2024 with net additions of 12,100, followed by a net increase of approximately 10,000 in the first half of 2025. This rate of increase is significantly lower than the average rate of net business formation before the pandemic but is a significant improvement over the net contraction in the number of businesses in 2022 and 2023 during the cost-of-living crisis.

The net changes are equivalent to 0.5%, 1.3%, 1.6%, 0.5%, 0.3%, -1.7%, -1.0% and 0.4% in the total number of registered businesses in 2017 to 2024 respectively and annualised growth of 0.7% in the first half of 2025.

The total number of PAYE and VAT registered businesses is projected to have reached around 2.75m in June 2025, based on the last published count for March 2024 plus reported movements since then. This is out of an overall total of somewhere in the region of 5.5m businesses in the UK, with the difference mainly due to single-person companies and sole traders that do not employ any staff and operate below the VAT threshold of £90,000 per year.

The approximately 2.75m registered businesses can be analysed into just under 2.1m companies and other types of corporations, approximately 400,000 sole proprietors, 150,000 or so partnerships, and around 100,000 non-profit bodies, mutual associations and public sector organisations. Approximately 945,000 registered businesses are in London and the South East, 675,000 are in the Midlands and the East of England, 535,000 in the North of England, 340,000 in the South West of England and Wales, 175,000 in Scotland, and 80,000 in Northern Ireland.

Business births between 2017 and 2024 were approximately: 338,700; 341,100; 355,700; 322,000; 354,300; 327,500; 307,100; and 310,100; there were 167,600 in the first half of 2025. Business deaths in 2017 to 2024 were: 325,300; 304,800; 311,400; 308,300; 344,900; 375,500; 333,400; and 298,000; with 157,600 in the first half of 2025.

The overall change in the total number of registered businesses between 2017 and the first half of 2025 was 63,900, an average of 7,500 or 0.3% a year over eight and a half years, comprising an annual average of 332,100 business births less 324,600 business deaths in that time.

The chart highlights both the very difficult economic times we have been through in the past few years with the pandemic and cost-of-living crisis and the current period of weak economic growth that has yet to return to pre-pandemic levels.

One of the key ways that we can increase the rate of net business formation is to make it easier to do business in the UK, as discussed in ICAEW’s growth campaign. This asks why it is too difficult, too expensive and too uncertain to do business in the UK today and suggests ways the government can streamline regulation, reduce costs and unnecessary frictions, and provide businesses with greater confidence to invest and grow.
This chart was originally published by ICAEW.

ICAEW chart of the week: Regional capex

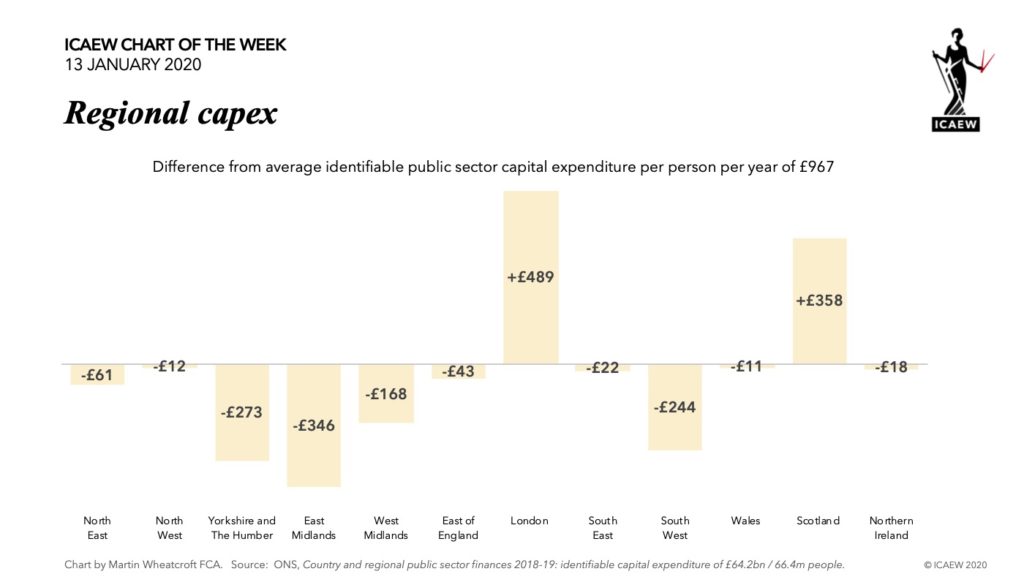
Chart: Difference from average identifiable public sector Capex per per year of £967. See table at end of post.

The #icaewchartoftheweek this week is on the subject of public sector capital expenditure across the UK in the light of speculation that the Spring Budget in March will feature a significant boost to capital spending in the North of England.

We thought it might be interesting to look at the most recent data; albeit the usual caveats apply to the numbers given the lack of formal systems in government to fully track expenditure by region and the differences between capital expenditure in the fiscal numbers (shown in the chart) and the capital expenditure reported in the (as yet unpublished) Whole of Government Accounts for 2018-19.

According to the ONS, there was £64.2bn in capital expenditure that can be identified by nation and region of the UK, an average of £967 for the 66.4m people living in the UK in 2018-19.

It is perhaps not surprising that there is more capital spending in London than the per capita average given that the millions of commuters and visitors that add to the 8.9m local population every day. However, the scale of the difference is substantial with £13bn invested in 2018-19, an average of £1,456 per person – £489 more than the UK average.

Of course, variations in capital expenditure are to be expected across a country of the size of the UK given the different natures and needs of each region and nation. For example, Scotland’s much higher level of per capita public capital expenditure (£7.2bn / 5.4m people = £1,325 per person) needs to be seen in the context that it comprises a third of the land area of the entire UK, but only has 8% of the population.

The region that incurs the least capital expenditure on a per capita basis is the East Midlands, where £3.0bn was spent in 2018-19, an average of £621 per person (£346 less than the average) for each of the 4.8m people living there. This is followed by Yorkshire and The Humber (£694 per person), the South West (£723) and the West Midlands (£799).

Most of the other regions are close to the average, including (perhaps surprisingly given some of the headlines), the North East and the North West.

One question that does come to mind – if Government’s intention is to rebalance regional inequalities by investing more in the ‘Northern Powerhouse’ and the ‘Midlands Engine’, will it have anything to spare for the ‘Great South West’ too?

2018-19
Capex

Population
Per
capita
Difference
from average
North East£2.4bn2.7m£906-£61
North West£7.0bn7.3m£955-£12
Yorkshire and The Humber£3.8bn5.5m£694-£273
East Midlands£3.0bn4.8m£621-£346
West Midlands£4.7bn5.9m£799-£168
East of England£5.7bn6.2m£924-£43
London£13.0bn8.9m£1,456+£489
South East£8.6bn9.1m£945-£22
South West£4.0bn5.6m£723-£244
Wales£3.0bn3.1m£956-£11
Scotland£7.2bn5.4m£1,325+£358
Northern Ireland£1.8bn1.9m£949-£18
United Kingdom£64.2bn66.4m£967

Source: ONS, Country and regional public sector finances 2018-19: identifiable capital expenditure.