My chart for ICAEW this week illustrates how countries rank in the IMF’s latest forecasts for economic growth over 2024 and 2025.
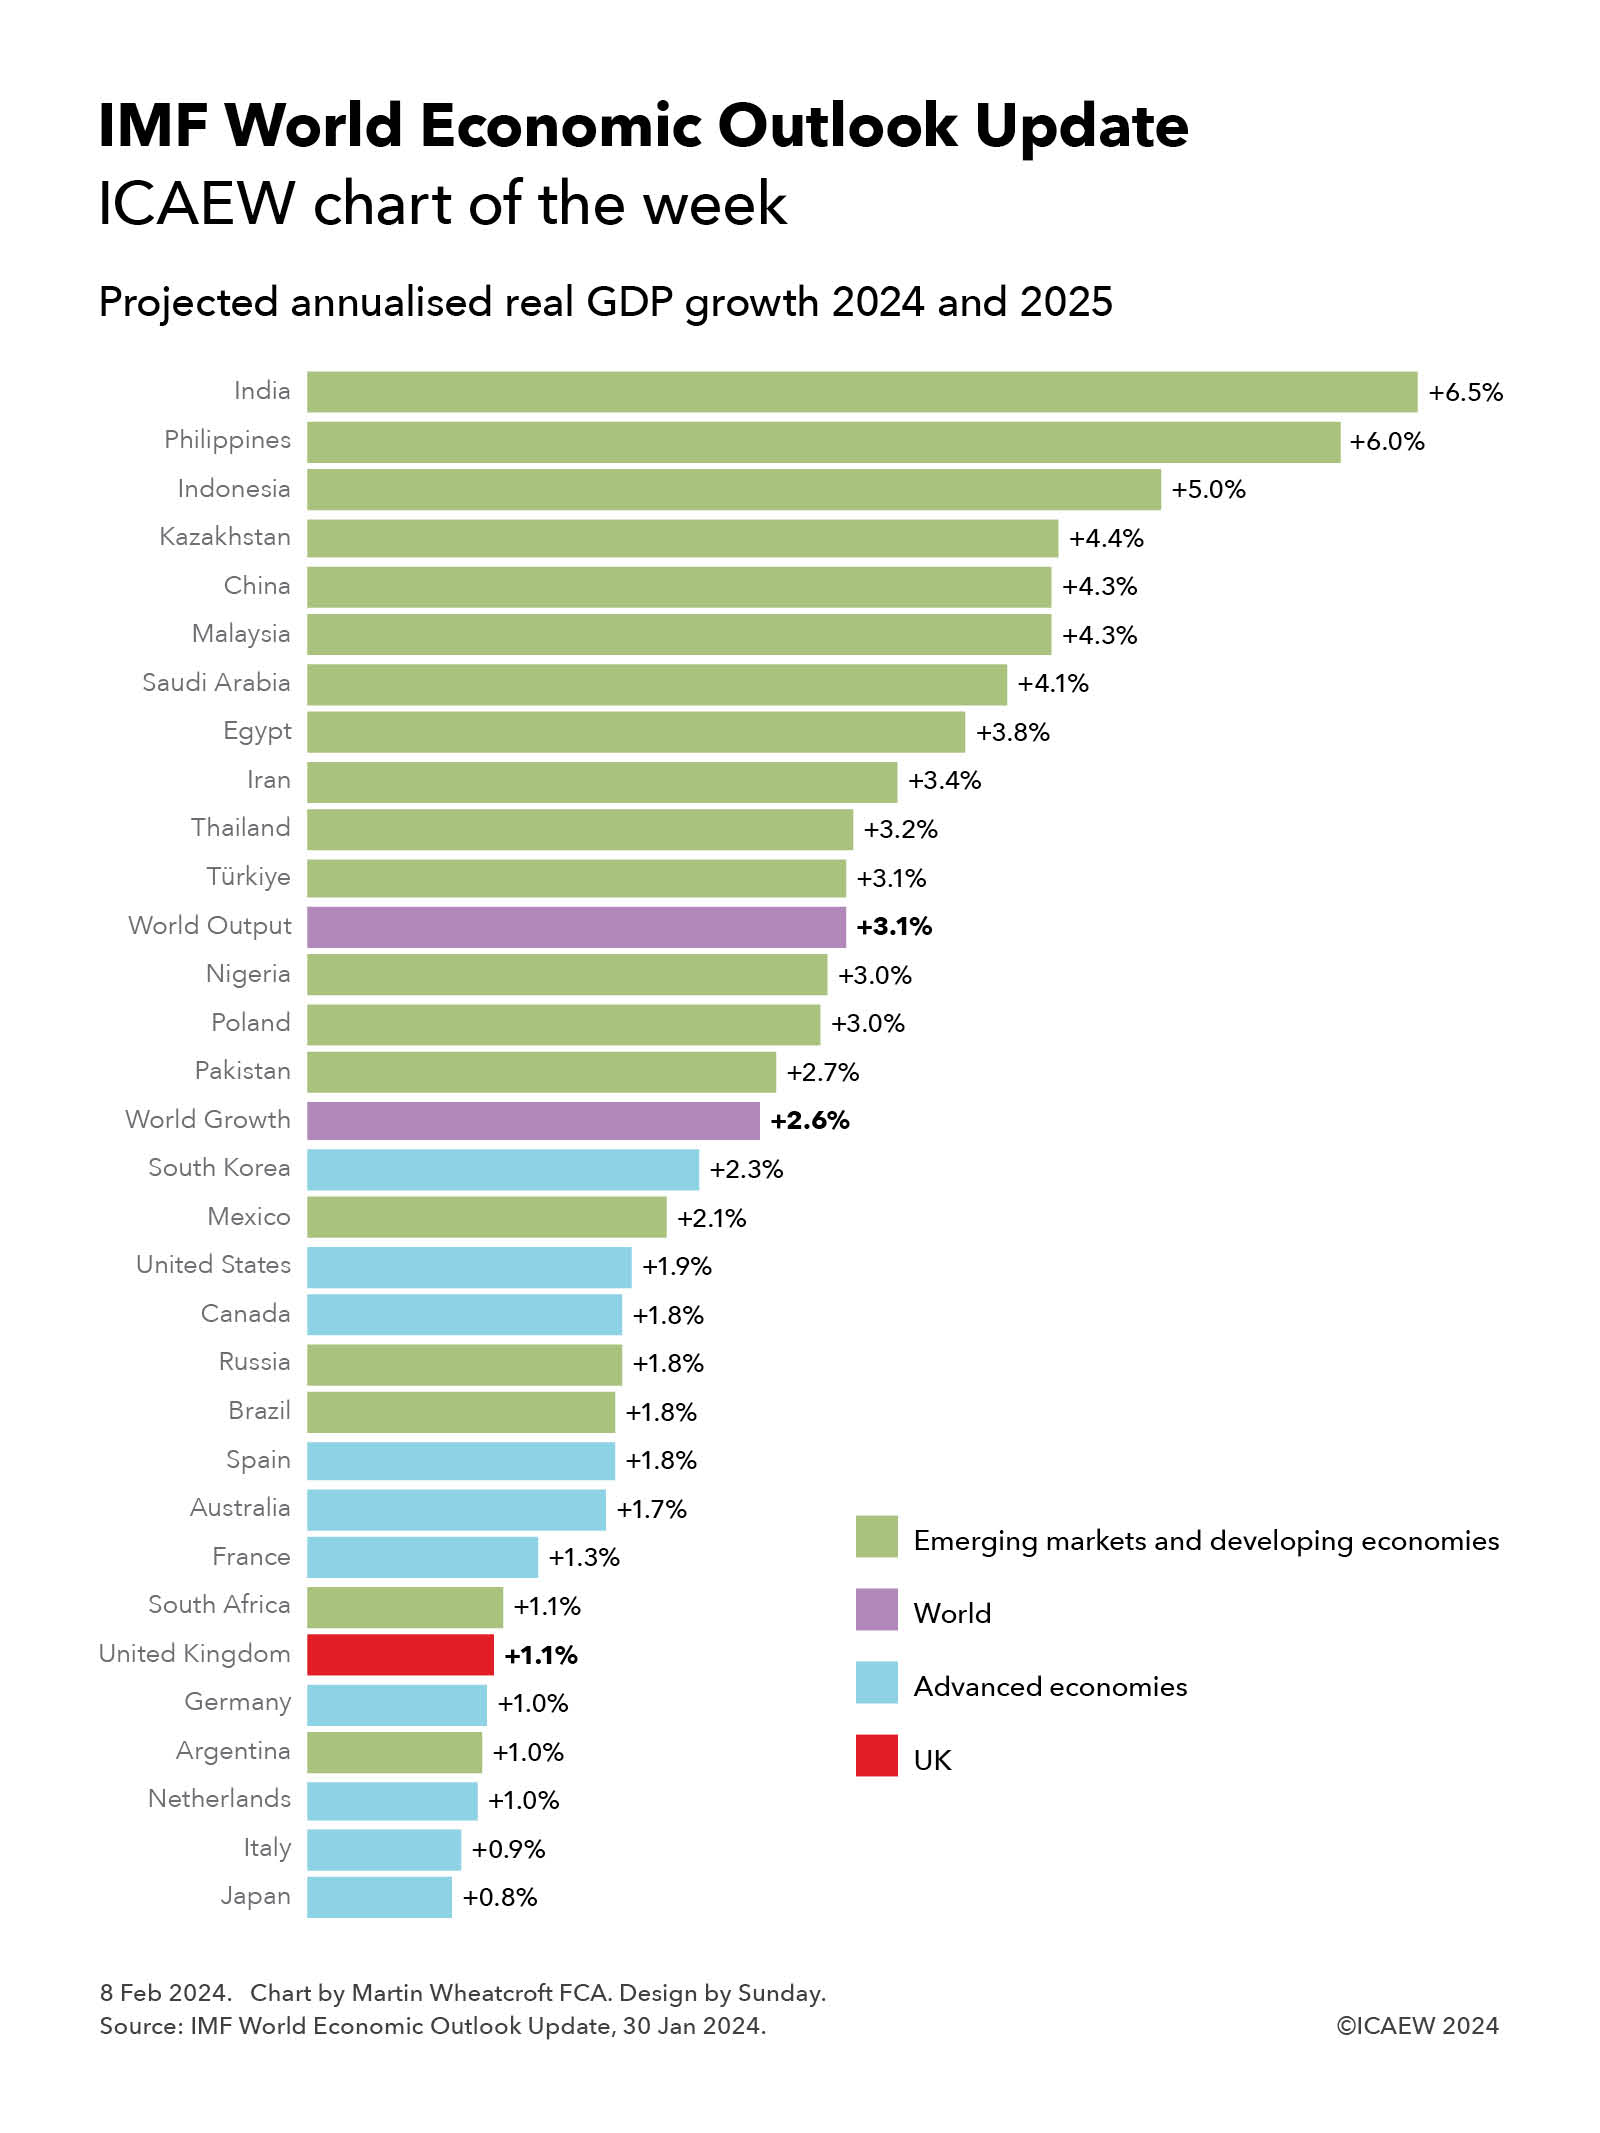
Each January, the International Money Fund (IMF) traditionally releases an update to its World Economic Outlook forecasts for the global economy. This year it says that it expects the global economy to grow by an average of 2.6% over the course of 2024 and 2025 at market exchange rates, or by 3.1% when using the economists-preferred method of converting currencies at purchasing power parity (PPP).
The chart shows how the 30 countries tracked by the IMF fit between emerging market and developing economies, most of which are growing faster than the global averages, and advanced economies, which tend to grow less quickly.
The biggest drivers of the global forecast are the US, China and the EU, with both the US and China expected by the IMF to grow less strongly on average over the next two years than in 2023. This contrasts with an improvement over 2023 (which involved a shrinking economy in Germany) by the advanced national economies in the EU over the next two years – apart from Spain, which is expected to fall back from a strong recovery in 2023.
Growth in emerging and developing countries is expected to average 4.1% over the two years, led by India (now the world’s fifth largest national economy after the US, China, Germany and Japan), followed by the Philippines, Indonesia, Kazakhstan growing faster than China, followed by Malaysia, Saudi Arabia, Egypt, Iran, Thailand and Türkiye.
Nigeria, Poland and Pakistan are expected to grow slightly less than world economic output, followed by Mexico.
Russia, Brazil and South Africa are expected to grow less strongly, while Argentina is expected to grow the least, with a forecast contraction in 2024 expected to be followed by a strong recovery in 2025.
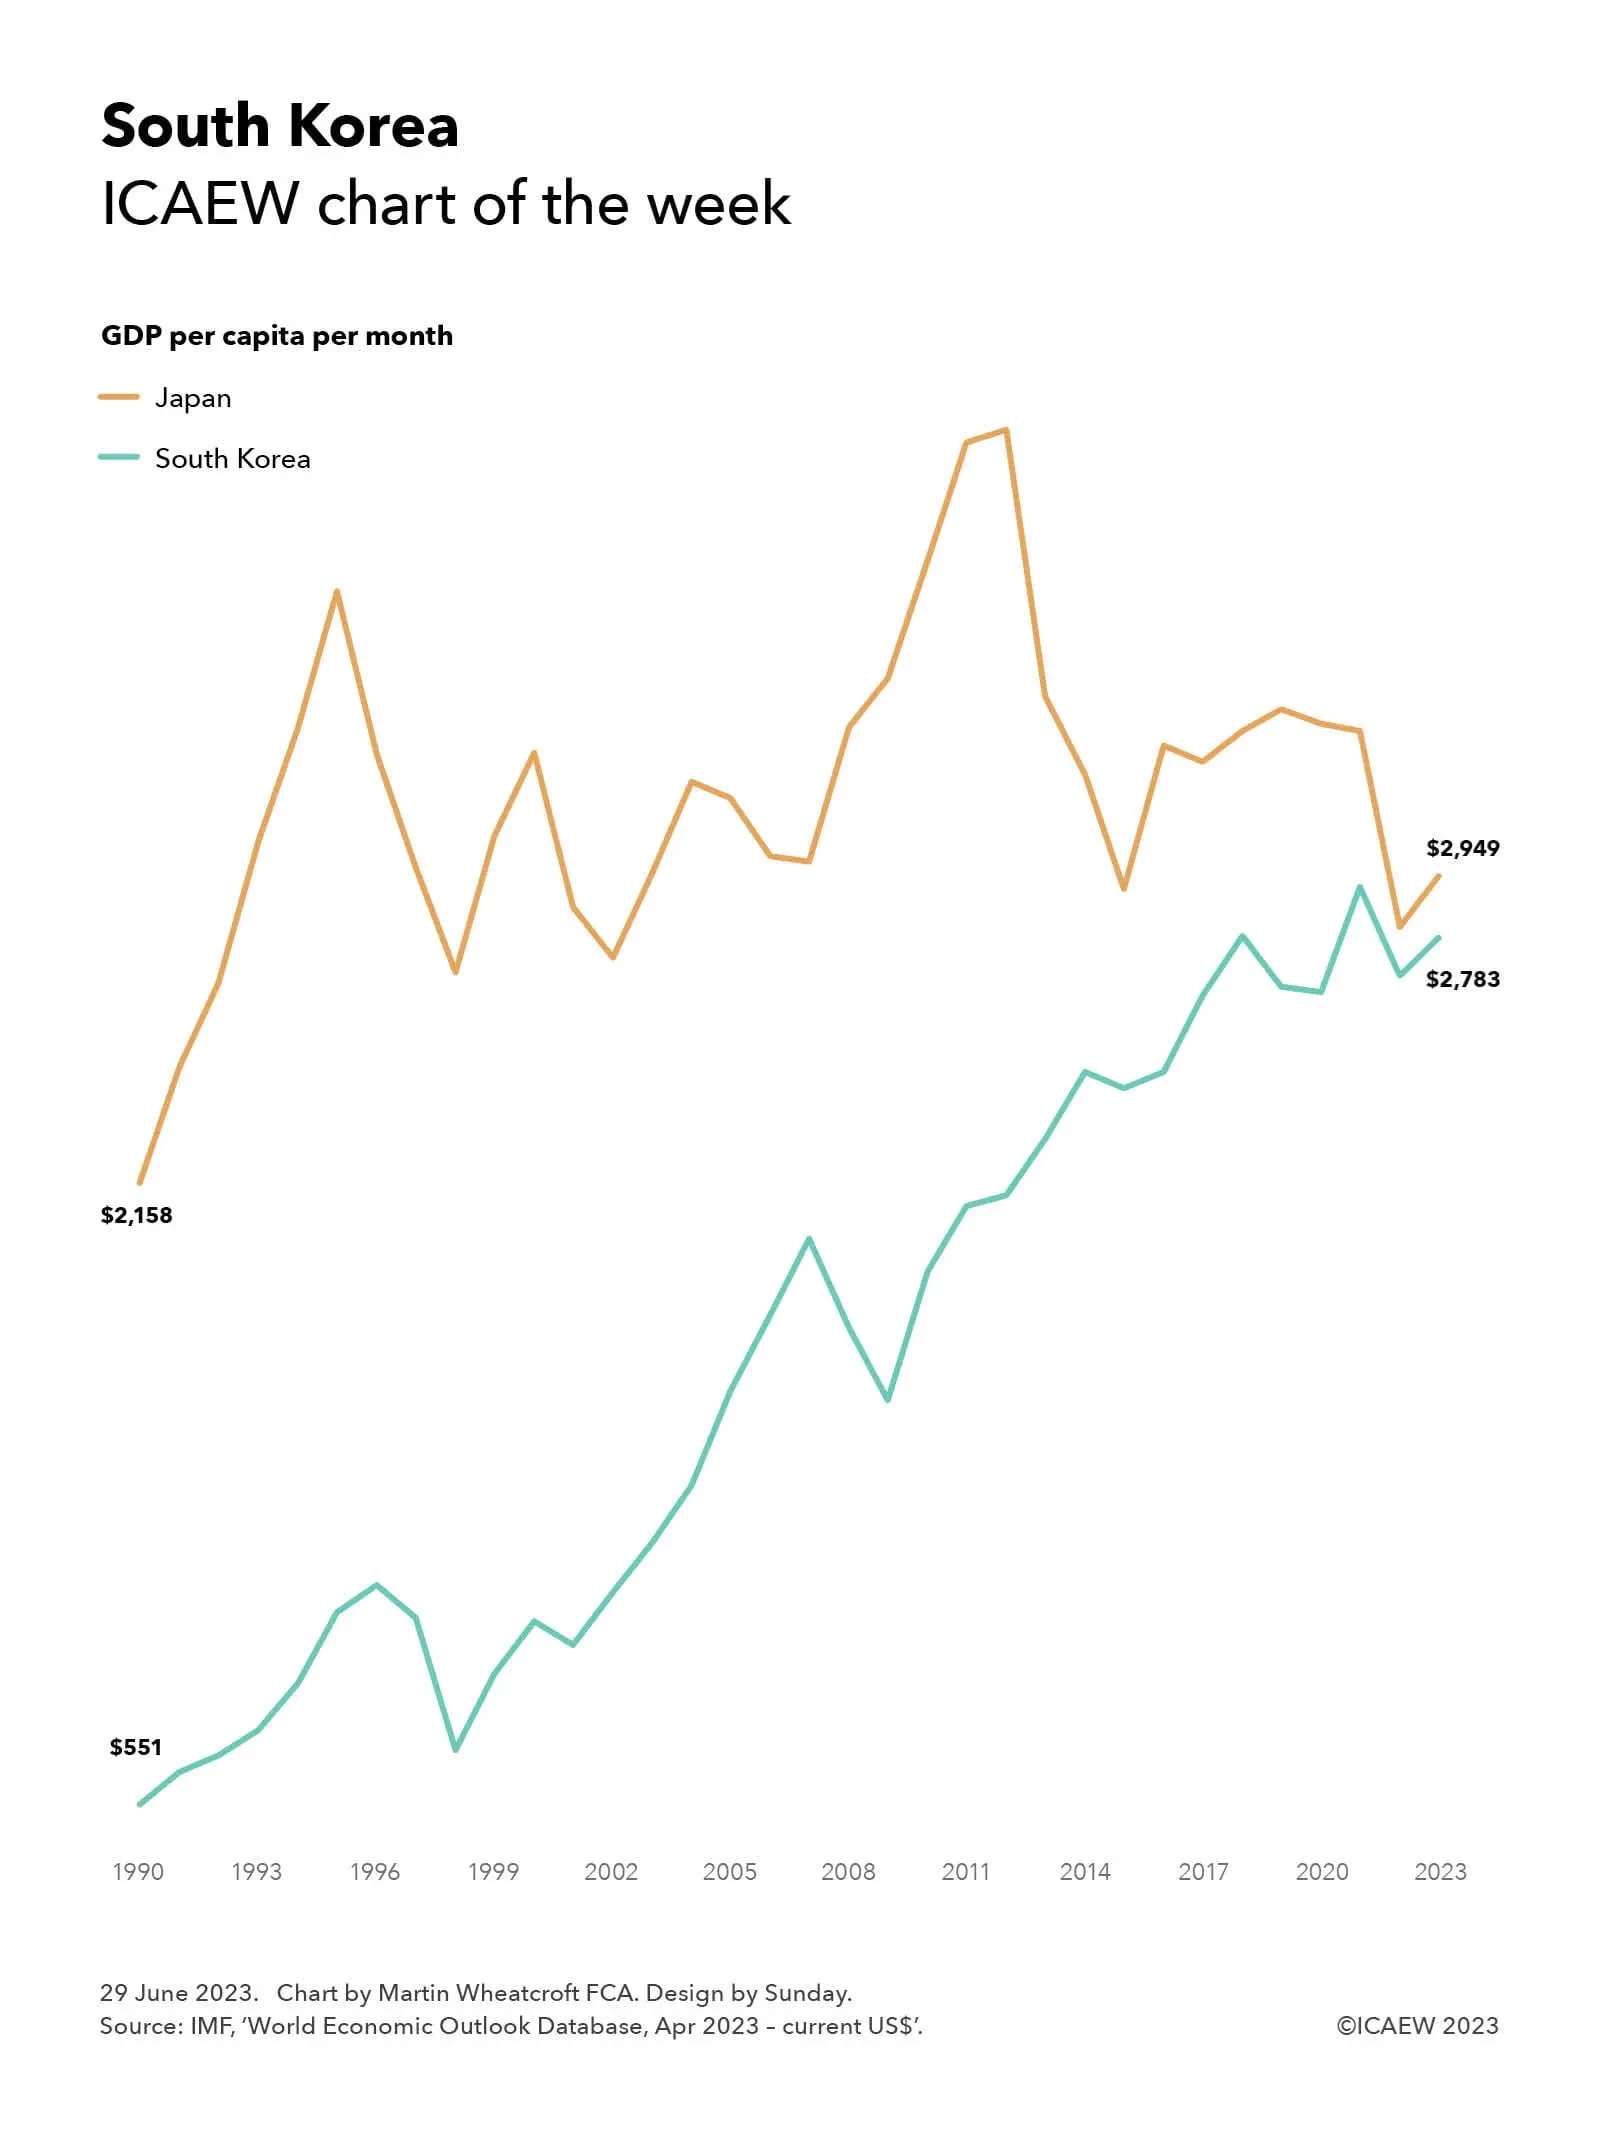
The strongest-growing of the advanced economies in the IMF analysis continues to be South Korea, followed by the US, Canada, Spain, Australia, France, the UK, Germany, the Netherlands and Italy, with Japan expected to have the lowest average growth. Overall, the advanced economies are expected to grow by an average of 1.6% over the next two years.
For the UK, forecast average growth of 1.0% over the next two years is expected to be faster than the 0.5% estimated for 2023, but at 0.6% in 2024 and 1.6% in 2025 we may not feel that much better off in the current year.
Of course, forecasts are forecasts, which means they are almost certainly wrong. However, they do provide some insight into the state of the world economy and how it appears to be recovering the pandemic.
For further information, read the IMF World Economic Outlook Update.
More data
Not shown in the chart are the estimate for 2023 and the breakdown in 2024 and 2025, so for those who are interested, the forecast percentage growth numbers are as follows:
Emerging market and developing countries:
| Country | Average over 2024 and 2025 | 2023 Estimate | 2024 Forecast | 2025 Forecast |
| India | 6.5% | 6.7% | 6.5% | 6.5% |
| Philippines | 6.0% | 5.3% | 6.0% | 6.1% |
| Indonesia | 5.0% | 5.0% | 5.0% | 5.0% |
| Kazakhstan | 4.4% | 4.8% | 3.1% | 5.7% |
| China | 4.3% | 5.2% | 4.6% | 4.1% |
| Malaysia | 4.3% | 4.0% | 4.3% | 4.4% |
| Saudi Arabia | 4.1% | -1.1% | 2.7% | 5.5% |
| Egypt | 3.8% | 3.8% | 3.0% | 4.7% |
| Iran | 3.4% | 5.4% | 3.7% | 3.2% |
| Thailand | 3.2% | 2.5% | 4.4% | 2.0% |
| Türkiye | 3.1% | 4.0% | 3.1% | 3.2% |
| Nigeria | 3.0% | 2.8% | 3.0% | 3.1% |
| Poland | 3.0% | 0.6% | 2.8% | 3.2% |
| Pakistan | 2.7% | -0.2% | 2.0% | 3.5% |
| Mexico | 2.1% | 3.4% | 2.7% | 1.5% |
| Russia | 1.8% | 3.0% | 2.6% | 1.1% |
| Brazil | 1.8% | 3.0% | 2.6% | 1.1% |
| South Africa | 1.1% | 0.6% | 1.0% | 1.3% |
| Argentina | 1.0% | -1.1% | -2.8% | 5.0% |
Advanced economies (including the UK):
| Country | Average over 2024 and 2025 | 2023 Estimate | 2024 Forecast | 2025 Forecast |
| South Korea | 2.3% | 1.4% | 2.3% | 2.3% |
| USA | 1.9% | 2.5% | 2.1% | 1.7% |
| Canada | 1.8% | 1.1% | 1.4% | 2.3% |
| Spain | 1.8% | 1.1% | 1.4% | 2.3% |
| Australia | 1.7% | 1.8% | 1.4% | 2.1% |
| France | 1.3% | 0.8% | 1.0% | 1.7% |
| UK | 1.1% | 0.5% | 0.6% | 1.6% |
| Germany | 1.0% | -0.3% | 0.5% | 1.6% |
| Netherlands | 1.0% | 0.2% | 0.7% | 1.3% |
| Italy | 0.9% | 0.7% | 0.7% | 1.1% |
| Japan | 0.8% | 1.9% | 0.9% | 0.8% |