The chart this week is on the topic (or is that tropic?) of temperature, illustrating how hot weather has become hotter since the 1880s.
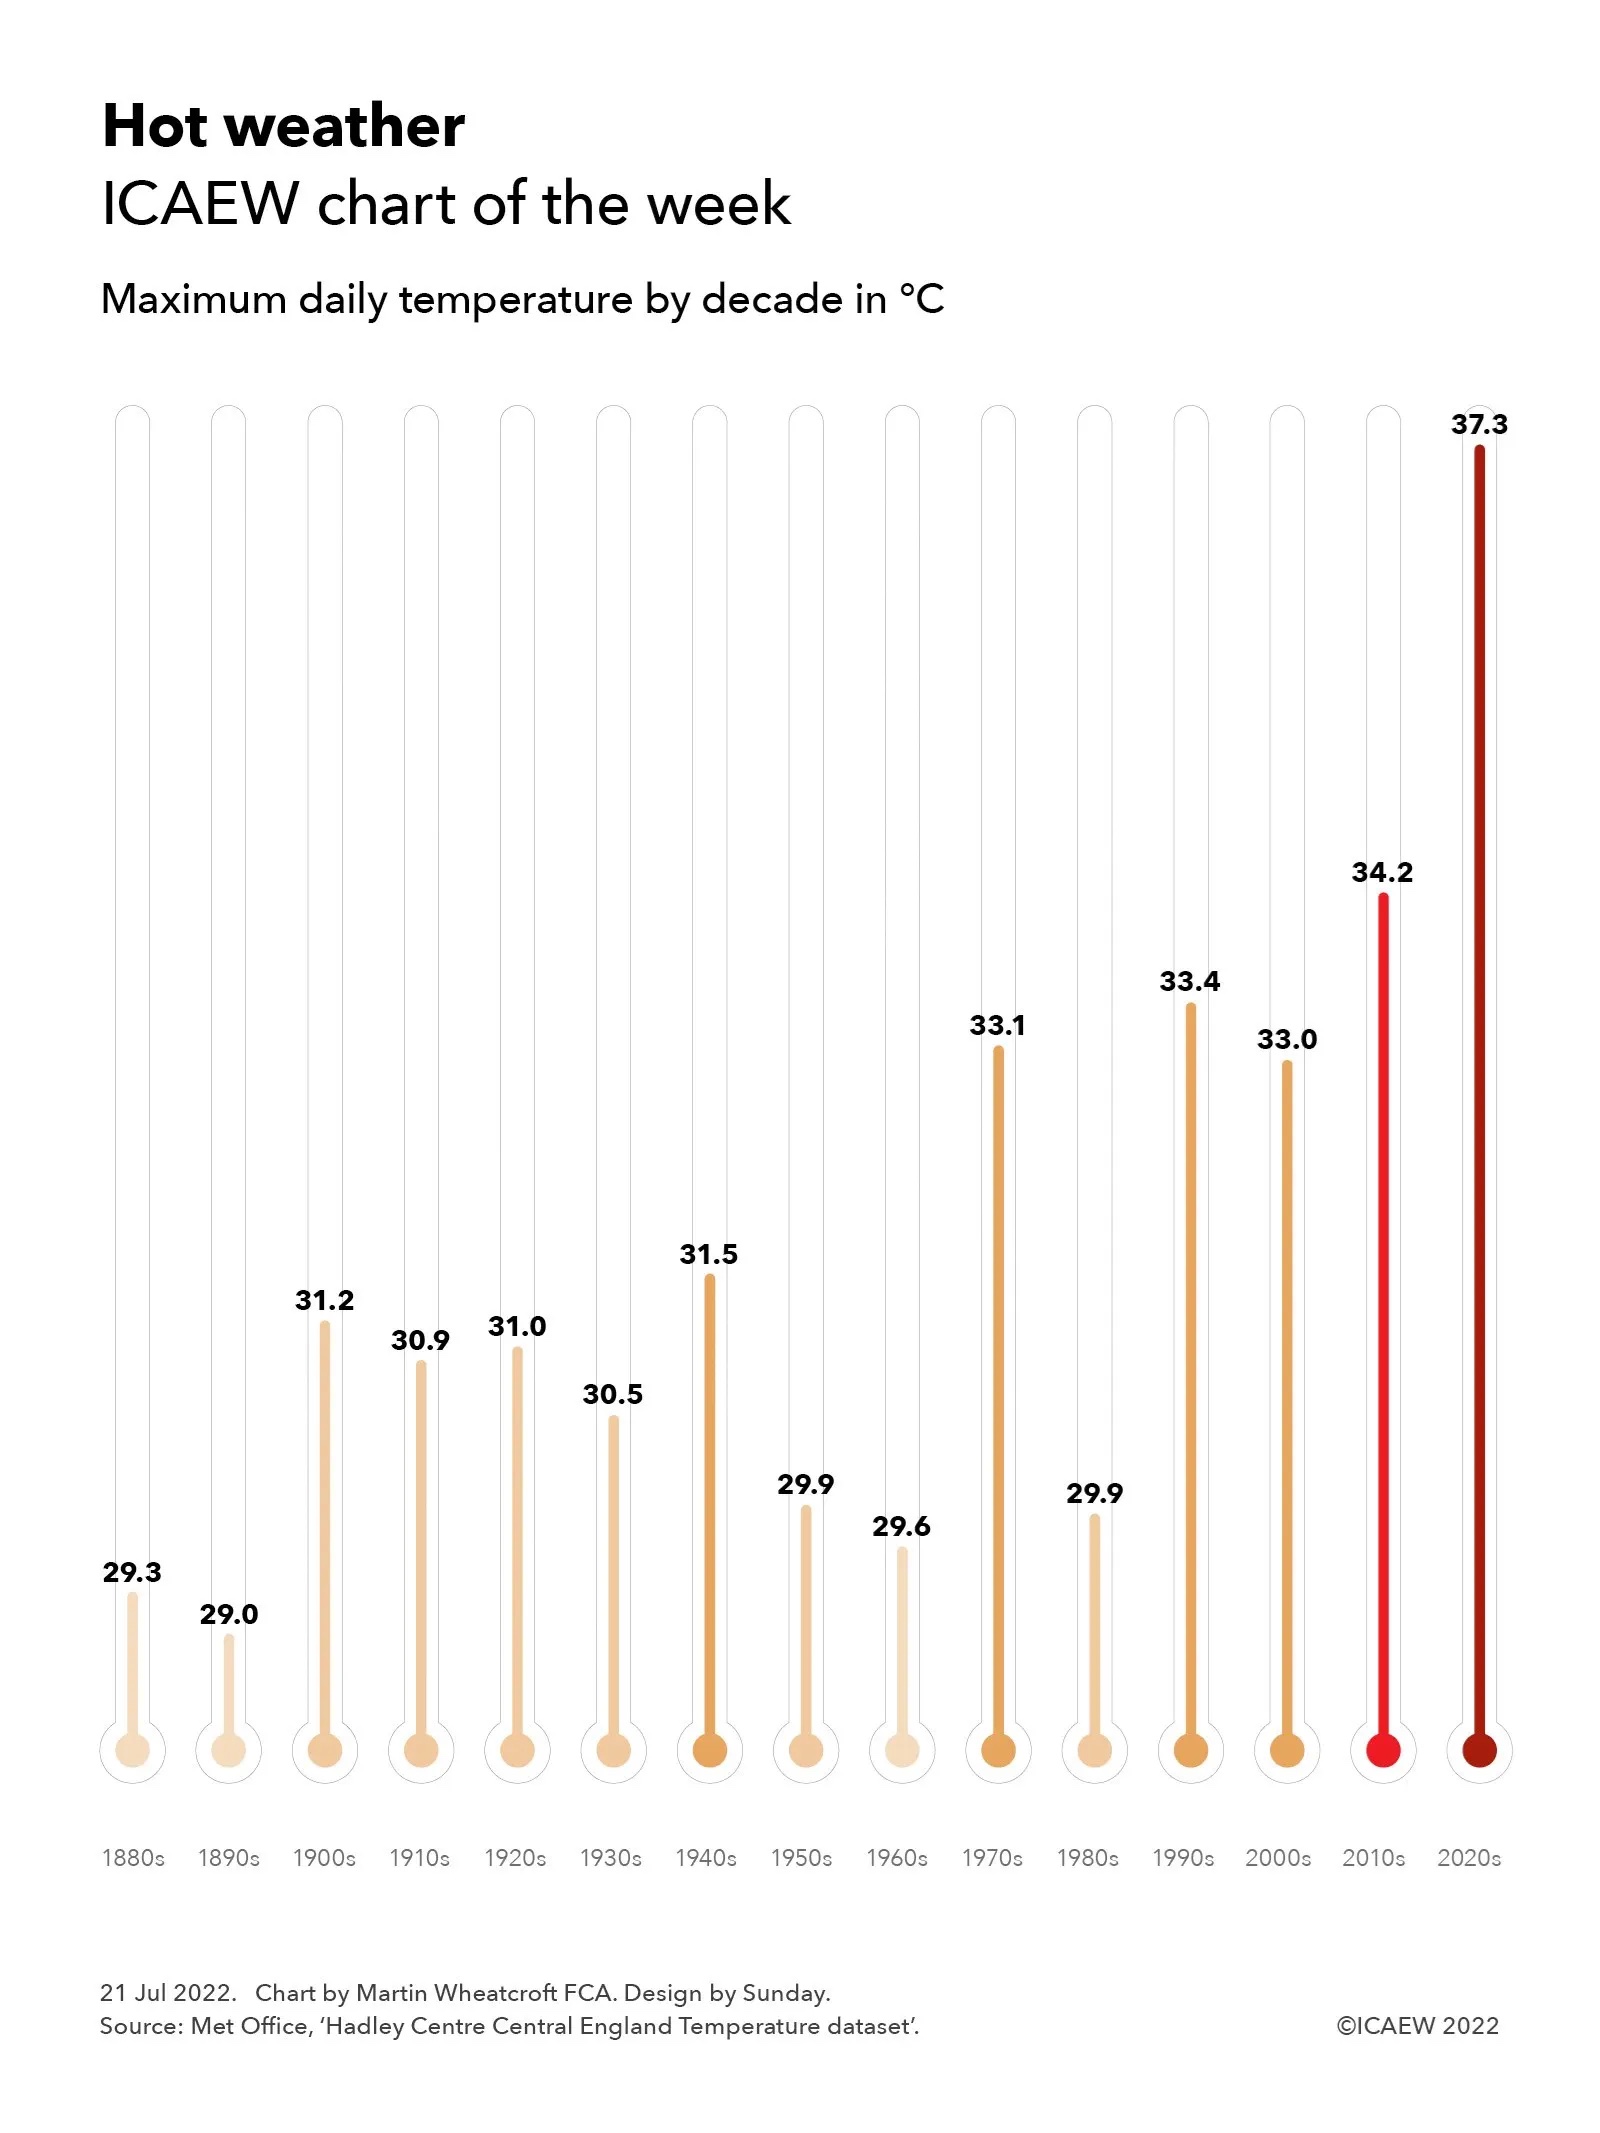
Our chart this week is on hot weather, looking at how the maximum daily temperature in each decade has increased since the 1880s, according to the Met Office’s Hadley Centre Central England Temperature dataset. This is not from a single weather station, but averaged from several stations in order to be “representative of a roughly triangular area of the United Kingdom enclosed by Lancashire, London and Bristol”, according to the Met Office.
The Central England dataset reported a maximum temperature of 37.3% on 19 July, three degrees below the provisional highest temperature ever recorded in the UK of 40.3°C in Coningsby in Lincolnshire on the same day. However, as the chart illustrates, this was still substantially higher than the highest temperatures reported in each of the previous decades.
Of course, the 2020s are far from over and there is a strong possibility that the peak in this decade will be even higher.
These were the maximum daily temperatures by decade in the Central England datasets:
1880s: 29.3°C (11 Aug 1884)
1890s: 29.0°C (18 Aug 1893)
1900s: 31.2°C (1 Sep 1906)
1910s: 30.9°C ( 9 Aug 1910)
1920s: 31.0°C (12 Jul 1923)
1930s: 30.5°C (27 Aug 1930)
1940s: 31.5°C (29 Jul 1948)
1950s: 29.9°C (6 Jun 1950)1
1960s: 29.6°C (29 Aug 1961)
1970s: 33.1°C (3 Jul 1976)
1980s: 29.9°C (28 Jul 1984)
1990s: 33.4°C (3 Aug 1990)
2000s: 33.0°C (19 Jul 2006)
2010s: 34.2°C (25 Jul 2019)
2020s: 37.3°C (19 Jul 2022)
This approach does not provide a full picture of climate change over the past 140 years, as we are just looking at the daily peaks of temperature in each decade. However, it does echo more scientifically-rigorous analysis of the climate that confirms that the planet is warming up, with even hotter temperatures expected in future decades if we don’t take action.