ICAEW chart of the week – UK trade with the rest of the world

Ross Campbell, ICAEW Director for Public Sector, writes:

As talks about the EU exit charge and trade deals continue, this week’s ICAEW Chart of the Week is on the topic of international trade.  

The UK ran a substantial £92bn surplus in its trade in services in 2016, with exports of £245bn exceeding imports of £153bn.

However, this was more than offset by a £135bn deficit in its trade in goods, with exports of £302bn more than exceeded by imports of £437bn.  Overall the net trade deficit amounted to £43bn.  This looks like a large number, but at 2% of GDP it should be seen in the context of the UK economy of over £2 trillion. 

What the chart does illustrate is the significance of the UK’s trading relationship with the rest of Europe.  EU and EFTA countries take 48% of the UK’s exports and provide 58% of our imports. After the EU and EFTA, the UK’s three largest trading partners were the USA, China and Japan.

We’ll cover how the trade deficits forms part of the overall current account deficit in a future chart.  But our main point is that international trade is a key part of the economy and the UK currently buys more from overseas than it sells. 

Given our history as a trading nation and the need in our current circumstances to forge new trading relationships, perhaps its time for a bit more support for our export drive?”

To comment, visit the ICAEW Talk Accountancy blog.

ICAEW chart of the week – PFI contracts

This Chart of the Week follows on from our promise to look into how we might construct an estimate of the financial implications of terminating the current PFI deals.

It’s not a straightforward exercise – while the debt liabilities with PFI are well recorded, without access to all of the contracts, we have had to make an educated guess at the sub-contract breakage costs and the compensation for lost profit based on our knowledge of standard SoPC terms, which may not apply to all contracts.  In doing so we believe we have erred on the side of caution, so the bill for an authority termination could potentially be higher.

We have better data for the debt associated with PFI however, so we are reasonably confident that the amount that would need to be refinanced is of the right order of magnitude. 

While an additional £89bn does not represent a large proportion of the outstanding National Debt of nearly £1.8 trillion, it would be a further step in the wrong direction for the already highly leveraged UK state and add to the challenge the Chancellor faces in meeting his fiscal mandate.  It would also increase the government’s refinancing requirement over the next five years to approximately £740bn – nearly three quarters of a trillion pounds – where the government is exposed to the risk of changes in interest rates. 

With the era of very low interest rates and inflation drawing to an end I am struck, that much like with comedy, when it comes to debt-raising, ‘timing is everything’.

For further information and to comment, visit the ICAEW Talk Accountancy blog.

ICAEW chart of the week – Taxes and other income

This week’s chart of the week from ICAEW looks at the revenue side of the public finance equation.

As the second Budget of the year approaches, the Chancellor faces a dilemma. With productivity and economic growth sluggish, will he try to find more money for public services by increasing taxes or attempt to stimulate the economy by lowering them?

Chancellors often use the first Budget following an election to increase taxes.  The problem on this occasion is that it will be difficult politically to increase one of the “Big 3” taxes (income tax, VAT and NI) that  generate 60% of the government’s  income.

However, it is also difficult to see how the Chancellor could raise significant sums from any of the next five biggest taxes that together generate a further 21% of total income. All of business rates, council tax and fuel duties are constrained by political pressures. Further hikes in  stamp duty are also unlikely, and the Government has committed to reducing corporation tax, from 19% this year to 17% in 2020.

With few opportunities to raise anything significant from other taxes, this leaves borrowing as the alternative. The good news is that the government is on course to come in several billion pounds below its borrowing target for this financial year.

ICAEW chart of the week – Public spending

Ross Campbell, Director for the Public Sector for the ICAEW, writes:

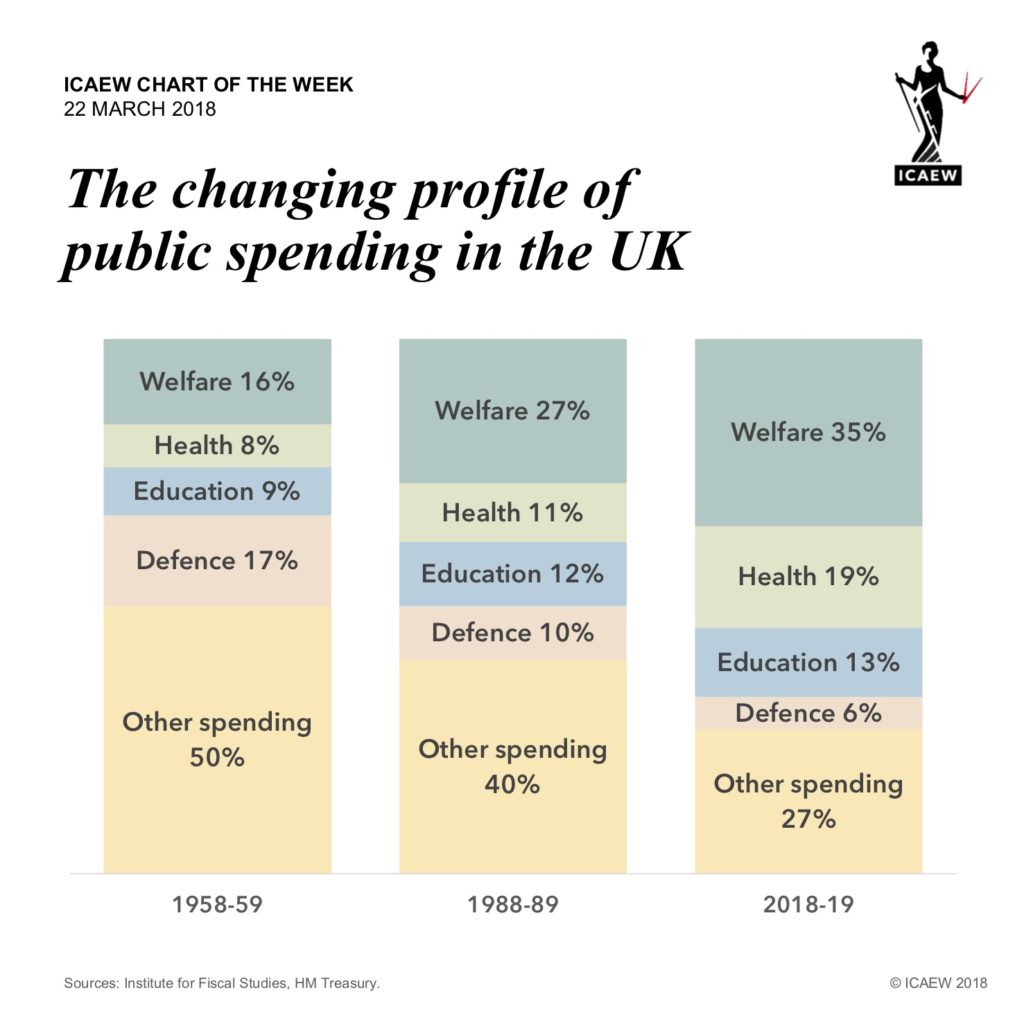
“With the budget rapidly approaching this week’s chart sets out the main components of planned public spending this year. Just over half (53%) is planned to go on the “welfare state”, comprising health and social care as well as pensions and welfare benefits.

With interest taking a further 6%, that leaves £330bn or 41% of the total to spend on delivering public services.

With an estimated population of just over 66 million people living in the UK, the total planned spending of £802bn in 2017/18 is equivalent to approximately £1,010 per person per month – the first time monthly spending has exceeded £1,000 per head.

The Chancellor approaches the Autumn Budget in a difficult position. There are requests for additional resources from the NHS, for social care, for the roll-out of Universal Benefit, for schools and colleges, for the armed forces, for roads and rail, for housing and for the police and border control.  Combined with higher interest costs as interest rates and inflation rise, this means that spending is likely to rise.

He may have some room for manoeuvre for the rest of the current financial year, as tax revenues appear to be holding up and costs remain relatively under control so far. However, constraining spending growth in future years is probably going to be harder. For example, the Spring Budget envisaged total spending in 2018-19 of £817bn, an increase of just 1.8% compared with this year. With inflation now running at 3% and so many pressures on spending to contend with, this particular number will be one to watch when we get to the Autumn Budget.”

To comment, please visit the ICAEW Talk Accountancy blog.

ICAEW chart of the week – Deficit reduction

Ross Campbell, Director for the Public Sector for the ICAEW, writes:

“After a pause last week while I was behind the Great (fire)wall of China, the ICAEW chart of the week resumes with a look at how the Government has got on with tackling the UK’s current expenditure deficit.

Steady progress was made between 2009-10 and 2016-17 with the numbers mostly going in the right direction and the deficit falling from £152bn to £45bn.  While this is progress it is however still important to remember that we are still spending more than we earn as a nation – a situation that is not sustainable in the long run.

The impact of the chancellor’s decision to ease up on public consolidation in the March 2017 budget is also striking – with the deficit increasing again to £58bn in 2017-18 it has turned dealing with the deficit into a 15 year (or three parliament) problem. Continuing to run a deficit means borrowing money every year to pay the running costs.  With the National Debt at an all time high for peacetime and UK facing a worsening macro-economic position, the cost of that borrowing is only going to put further pressure on public expenditure.

It is time to deal with the deficit once and for all.”

To comment, visit the ICAEW Talk Accountancy Blog.

ICAEW chart of the week – EU Budget 2017

Ross Campbell, Director for the Public Sector for the ICAEW, writes:

“This week’s chart continues the Brexit theme by looking at where the money that we pay to the EU is spent.

It shows how Germany, the UK, France and Italy are the largest contributors, with roughly 79bn euros going into the EU pot, while they receive only about 44bn euros of that back.  The majority of their net contributions go toward post-2000 EU members, principally in eastern Europe, while pre-2000 countries such as the Netherlands, Sweden, Denmark and Austria which also pay in more than they get back are substantially balanced by countries such as Spain, Greece, Portugal and Belgium who are net recipients.

Only a relatively small proportion of the UK’s net contribution goes toward the cost of running EU institutions, agencies and programmes. Instead most of the net contribution actually ends up being spent further east, on economic development programmes in Poland, the Czech Republic, Romania, Hungary and Bulgaria. Consequently the focus on how much the UK is going to contribute to agencies such as Europol or the European Space Agency, or to programmes such as Erasmus, is really missing the point – these are small amounts compared to economic development funding for eastern Europe.

It is worthwhile observing that these countries are now NATO allies and all of them made commitments to increase defence spending on the basis of national budgets that assumed continued funding from the UK via the EU. It is also worth observing that with increased tensions between NATO and Russia – it may well be in the UK’s strategic interest to continue to support increased defence spending in eastern Europe.”

To comment, visit the ICAEW Talk Accountancy blog.

A billion pounds is a lot of money. Or is it?

A billion pounds is a lot of money.

Even when using the now commonly accepted ‘American’ meaning of the word, a billion is a seriously big number. At a thousand million, or 1,000,000,000 (that’s nine zeroes) it is decidedly large.

A pound may not be worth so much these days, but a billion of them? A very large sum of money in any language.

Indeed, for almost everyone apart from those tiny number of people who have that sort of wealth already, the value of a billion pounds is difficult to imagine. The interest in one year alone would be many times the amount most of us might hope to earn in our entire lifetime. To be able to afford thousands of homes, when many struggle to even buy one. Lots of money. Loads.

At the same time, a billion pounds is not a lot of money.

You hear about them on the news all the time. Our government plans to spend 802 of them this year and so one billion is small change, just 0.12% of a year’s spending. So small that the government could decide to spend an extra billion pounds and it might not even show up in the numbers due to rounding.

Of course, the reason for this duality is simple; for a country with tens of millions of inhabitants, even very small amounts for each individual add up to a lot of money.

Thus £1 billion is just £15.10 per person when spread over the 66.1 million people that live in the UK. On a monthly basis, that’s only £1.26 for each of us.

Enough to buy a high street coffee every other month. Not very much at all.

You can start to understand why there are so many of these billions around. A £4 billion cut in spending; that would save each of us about £5 a month. That extra £2 billion on housing? That’s going to cost us an additional £2.50.

So, when you hear that the government intends to spend an extra billion pounds a year on something or other to make our lives better, just remember that it is not a big amount of money at all.

Even so, it is also important to realise something too.

A billion pounds is a lot of money.

ICAEW chart of the week – The EU exit bill

Ross Campbell, Director for the Public Sector for ICAEW, writes:

“With the UK-EU negotiations rumbling on in Brussels, this week’s chart shows the range of likely scenarios that the ICAEW has modelled for the exit charge.

The softening in tone from Downing street following the Prime Minister’s speech in Florence last week, leads us to the conclusion that the ‘high’ scenario now appears to be a more likely outcome.  The speech proposed that UK would seek a transition period after the UK’s departure from the European Union on 30 March 2019. This should run for a period of at least 21 months until the end of 2020, covering the remainder of the EU’s 2014-2020 multi-year financial framework (MFF).

The statement that no country would pay more or less towards the EU Budget indicates that the UK now expects to contribute to the EU on the same basis during the transition period up until the end of 2020 as if it had remained a member. It also implies that the UK has accepted that it will need to contribute towards spending authorised before 2020 that will be paid out in the years after 2020. For example, for years 4 to 10 of a ten-year research grant authorised and starting in 2018.

Our Chart of the Week comes from our report ‘Analysing the EU exit charge’, which sets out the different components of the exit charge in a short digestible summary document. It can be found at:

http://www.icaew.com/technical/economy/brexit/analysing-the-eu-exit-charge.

 One question not yet answered is how much the UK will need to contribute for a longer transition period that extends into 2021 or further, nor to the financial arrangements in order to participate in EU agencies and programmes in the longer-term. So even if both sides can wrap up a deal on the exit charge soon, there remain several more financial negotiations to conduct in the months to come.

Of course, as we all know when it comes to negotiations – nothing is agreed until everything is agreed! “

To comment, please visit the ICAEW Talk Accountancy blog.

Printing money costs money

In a letter to the Guardian, Martin Wheatcroft comments on Professor Richard Murphy’s suggestion that ‘People’s QE’ can be used to finance government spending at no cost.

Professor Richard Murphy (Letters, 27 September) is mistaken when he claims that “QE debt carries no interest cost” and that we can ignore capital markets by using “People’s QE” to finance public spending cost-free. As a chartered accountant, he should know better. No debit exists without a credit, and the purchase of bonds by the Bank of England results in one form of public debt (government securities) being replaced by another (Bank of England deposits). Interest is payable on these deposits at the Bank of England base rate – currently 0.25%. This is not zero.

Quantitative easing swaps the benefit of locking-in the interest rate payable on long-term fixed-rate government securities for variable interest charges. The good news is that the £435bn of QE debt that we have today has been swapped into deposits paying 0.25%, costing the exchequer just £1bn in interest each year on this element of the national debt. However, the base rate could change very quickly depending on economic conditions and the decisions of the Monetary Policy Committee. An increase to 2% – historically still quite low – would cost an extra £8bn a year in interest, while at 5% – the rate in 2006 before the financial crisis – the annual interest cost would be £21bn higher than it is now.

Borrowing to finance public spending can be a sensible policy in the right circumstances, especially if directed at infrastructure and other investments that generate economic growth. But, politicians considering People’s QE as a policy choice should understand that there is no such thing as free finance, even for governments. As it turns out, even printing money costs money.

Martin Wheatcroft
Author of Simply UK Government Finances 2017-18

ICAEW chart of the week – EU contributions

Ross Campbell, Director for the Public Sector for ICAEW, writes:

“With the discussion in politics once again turning to the size of the saving that the UK will make when it stops paying contributions into the EU, this week’s chart is a reminder of what we currently pay and what we get back from the EU.

It is certainly worth noting that while the UK is a net contributor to the EU, both the gross contribution of £290m per week and the net contribution of £165m a week – what actually leaves the UK- are substantially smaller than the £350m a week claimed saving.

What is also worth bearing in mind is that the annual net contribution of approximately £8.6bn is really only about 1% of UK annual government expenditure.”

To comment, please visit the ICAEW Talk Accountancy blog.