A billion pounds is a lot of money. Or is it?

A billion pounds is a lot of money.

Even when using the now commonly accepted ‘American’ meaning of the word, a billion is a seriously big number. At a thousand million, or 1,000,000,000 (that’s nine zeroes) it is decidedly large.

A pound may not be worth so much these days, but a billion of them? A very large sum of money in any language.

Indeed, for almost everyone apart from those tiny number of people who have that sort of wealth already, the value of a billion pounds is difficult to imagine. The interest in one year alone would be many times the amount most of us might hope to earn in our entire lifetime. To be able to afford thousands of homes, when many struggle to even buy one. Lots of money. Loads.

At the same time, a billion pounds is not a lot of money.

You hear about them on the news all the time. Our government plans to spend 802 of them this year and so one billion is small change, just 0.12% of a year’s spending. So small that the government could decide to spend an extra billion pounds and it might not even show up in the numbers due to rounding.

Of course, the reason for this duality is simple; for a country with tens of millions of inhabitants, even very small amounts for each individual add up to a lot of money.

Thus £1 billion is just £15.10 per person when spread over the 66.1 million people that live in the UK. On a monthly basis, that’s only £1.26 for each of us.

Enough to buy a high street coffee every other month. Not very much at all.

You can start to understand why there are so many of these billions around. A £4 billion cut in spending; that would save each of us about £5 a month. That extra £2 billion on housing? That’s going to cost us an additional £2.50.

So, when you hear that the government intends to spend an extra billion pounds a year on something or other to make our lives better, just remember that it is not a big amount of money at all.

Even so, it is also important to realise something too.

A billion pounds is a lot of money.

ICAEW chart of the week – The EU exit bill

Ross Campbell, Director for the Public Sector for ICAEW, writes:

“With the UK-EU negotiations rumbling on in Brussels, this week’s chart shows the range of likely scenarios that the ICAEW has modelled for the exit charge.

The softening in tone from Downing street following the Prime Minister’s speech in Florence last week, leads us to the conclusion that the ‘high’ scenario now appears to be a more likely outcome.  The speech proposed that UK would seek a transition period after the UK’s departure from the European Union on 30 March 2019. This should run for a period of at least 21 months until the end of 2020, covering the remainder of the EU’s 2014-2020 multi-year financial framework (MFF).

The statement that no country would pay more or less towards the EU Budget indicates that the UK now expects to contribute to the EU on the same basis during the transition period up until the end of 2020 as if it had remained a member. It also implies that the UK has accepted that it will need to contribute towards spending authorised before 2020 that will be paid out in the years after 2020. For example, for years 4 to 10 of a ten-year research grant authorised and starting in 2018.

Our Chart of the Week comes from our report ‘Analysing the EU exit charge’, which sets out the different components of the exit charge in a short digestible summary document. It can be found at:

http://www.icaew.com/technical/economy/brexit/analysing-the-eu-exit-charge.

 One question not yet answered is how much the UK will need to contribute for a longer transition period that extends into 2021 or further, nor to the financial arrangements in order to participate in EU agencies and programmes in the longer-term. So even if both sides can wrap up a deal on the exit charge soon, there remain several more financial negotiations to conduct in the months to come.

Of course, as we all know when it comes to negotiations – nothing is agreed until everything is agreed! “

To comment, please visit the ICAEW Talk Accountancy blog.

Printing money costs money

In a letter to the Guardian, Martin Wheatcroft comments on Professor Richard Murphy’s suggestion that ‘People’s QE’ can be used to finance government spending at no cost.

Professor Richard Murphy (Letters, 27 September) is mistaken when he claims that “QE debt carries no interest cost” and that we can ignore capital markets by using “People’s QE” to finance public spending cost-free. As a chartered accountant, he should know better. No debit exists without a credit, and the purchase of bonds by the Bank of England results in one form of public debt (government securities) being replaced by another (Bank of England deposits). Interest is payable on these deposits at the Bank of England base rate – currently 0.25%. This is not zero.

Quantitative easing swaps the benefit of locking-in the interest rate payable on long-term fixed-rate government securities for variable interest charges. The good news is that the £435bn of QE debt that we have today has been swapped into deposits paying 0.25%, costing the exchequer just £1bn in interest each year on this element of the national debt. However, the base rate could change very quickly depending on economic conditions and the decisions of the Monetary Policy Committee. An increase to 2% – historically still quite low – would cost an extra £8bn a year in interest, while at 5% – the rate in 2006 before the financial crisis – the annual interest cost would be £21bn higher than it is now.

Borrowing to finance public spending can be a sensible policy in the right circumstances, especially if directed at infrastructure and other investments that generate economic growth. But, politicians considering People’s QE as a policy choice should understand that there is no such thing as free finance, even for governments. As it turns out, even printing money costs money.

Martin Wheatcroft
Author of Simply UK Government Finances 2017-18

ICAEW chart of the week – EU contributions

Ross Campbell, Director for the Public Sector for ICAEW, writes:

“With the discussion in politics once again turning to the size of the saving that the UK will make when it stops paying contributions into the EU, this week’s chart is a reminder of what we currently pay and what we get back from the EU.

It is certainly worth noting that while the UK is a net contributor to the EU, both the gross contribution of £290m per week and the net contribution of £165m a week – what actually leaves the UK- are substantially smaller than the £350m a week claimed saving.

What is also worth bearing in mind is that the annual net contribution of approximately £8.6bn is really only about 1% of UK annual government expenditure.”

To comment, please visit the ICAEW Talk Accountancy blog.

ICAEW chart of the week – Public sector net borrowing

Ross Campbell, Director for the Public Sector for the ICAEW, writes:

“This week’s ‘Chart of the Week’ shows two things.

First, that when the government talks about net borrowing, it doesn’t actually include everything that gives rise to an increase in the Government’s debts.  This is a statistical convention, but we accountants tend to think it is misleading as it under-represents the extent to which the country is living beyond its means.

Two, and more importantly, that the UK state is still spending significantly more than it earns in tax and other revenues.  It’s all very well calling for increases in public spending, but as existing spending is not currently covered by revenues, spending more creates an even bigger long term problem (with interest!) in the form of a growing debt burden. All that does is delay the difficult decisions about whether to raise taxes or cut spending to levels we can afford, all the while putting ever more pressure on public spending as the interest bill goes up.

As business people we know that the state is not a business, but in the long run similar rules apply and if it was a business, then it would be running at an ever increasing loss. We really need to improve financial management in government.”

To comment, please visit the ICAEW Talk Accountancy blog.

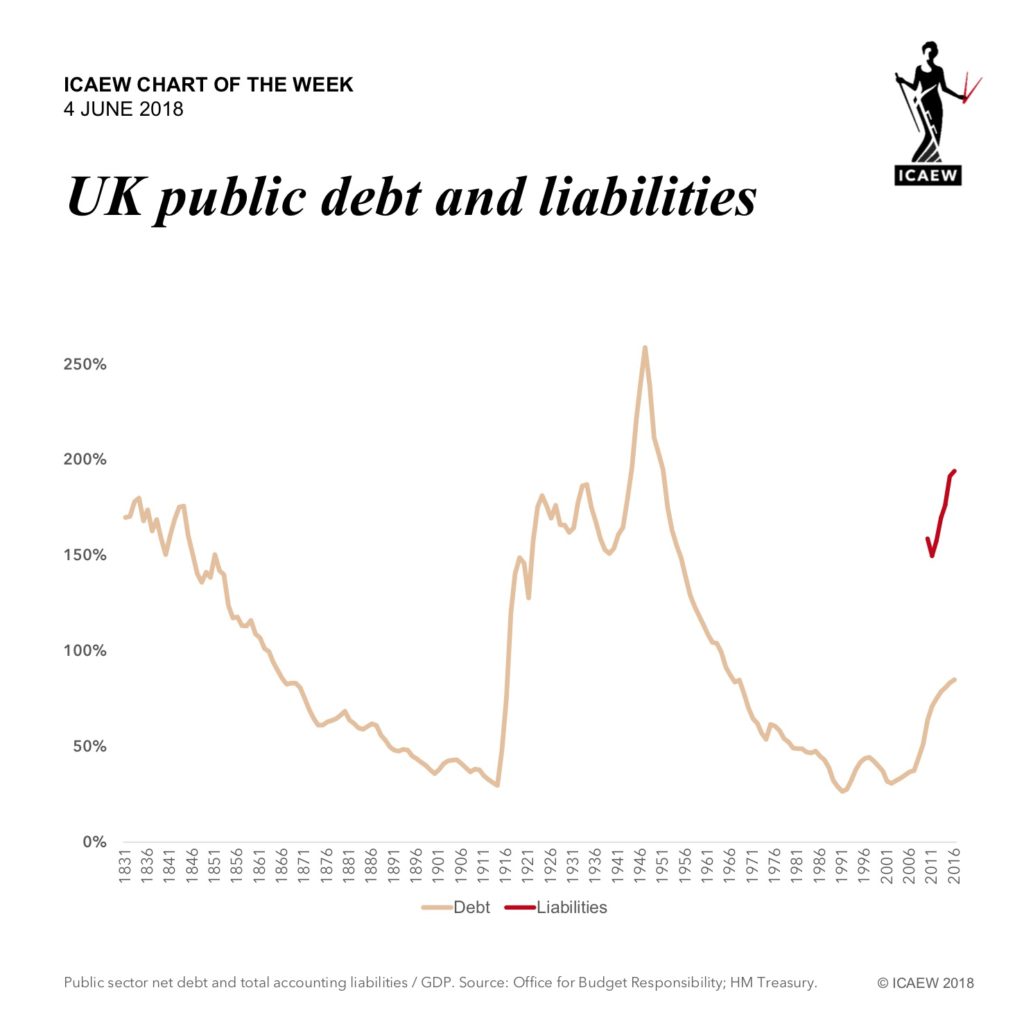
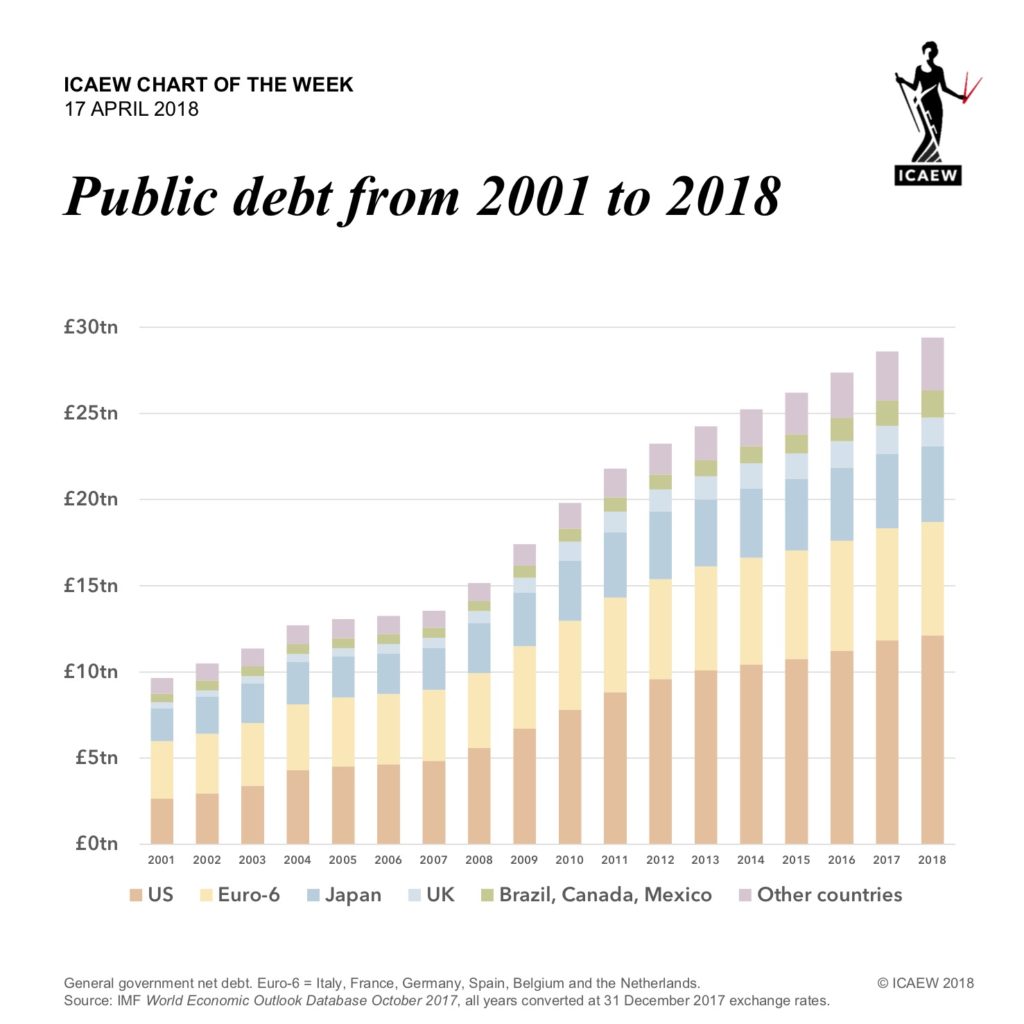
ICAEW chart of the week – Public debt

Ross Campbell, Director for the Public Sector for ICAEW, writes:

“Here is the latest Chart of the Week from the ICAEW.

This week’s chart shows that public debt has tripled over the last decade.

While economic growth has been at historically low levels over the last decade, reducing tax receipts, government borrowing has rocketed in order to keep paying for public services and social welfare. 

With the average life of borrowing now out to 18 years, as long as the government is still able to borrow, we won’t have to settle our debts anytime soon but we do have to pay the interest on all of this debt.  Let’s hope interest rates stay low!”

To comment, please visit the ICAEW Talk Accountancy blog.

Analysing the EU Exit Charge

Money will be a critical part of Brexit negotiations. In this report written for ICAEW, we reveal the key components of a deal and estimate the potential EU exit bill.

Key points to highlight:

  • Potential exit charges range from a low cost of £5bn to a maximum cost of £30bn, with the central scenario cost £15bn (based on an exchange rate of €1.20 to £1). This is equivalent to £225 per person expected to be living in the UK in 2019.
  • To put this in context, the UK’s share of the EU budget each year is approximately £20-£21bn, before an estimated rebate of £5-6bn, and spending returning to the UK of £6-£7bn.
  • While the estimated rebate is expected to be received back, the EU could attempt to withhold this if there is no agreement on wider exit charges.
  • Liabilities include EU staff pension and sickness payments which will be close to £63bn when the UK leaves, and of which the UK’s share is £10bn. This could be dealt with through a one-off settlement or the UK could agree to continue to contribute £0.2bn a year for the next 50 years or so.
  • The value of the EU’s fixed assets will also need to be determined, but as these are relatively small compared with other numbers revaluing them is unlikely to have significant impact on the total exit charge.
  • Additional areas for negotiation include the European Investment Bank (EIB), of which the UK has a 16% share. As ownership of the EIB is restricted to EU members, the UK may need to sell its stake to other EU members, or existing rules may need to change.
  • The EU is likely to argue that costs incurred caused by the UK’s decision to leave should be paid for by the UK rather than by other member states.

To find out more and to read the report, visit http://www.icaew.com/en/technical/economy/brexit/analysing-the-eu-exit-charge

Surprisingly, a lower corporate tax rate may actually discourage investment in the UK

The Autumn Statement is tomorrow, and the press is full of speculation that our new Chancellor Philip Hammond will not only hold to previously announced cuts in the corporation tax rate, but will announce a further reduction, despite an expected hit to the public finances from lower economic growth.

A reduction from the current rate of 20% is planned for this April when it is due to come down to 19%, with a further cut to 17% in April 2020. As a consequence it is likely that any new announcement will be in the form of a commitment to reduce the rate to 15% at some point in the next decade.

This definitely sounds attractive – the UK should be an even more rewarding place to base your business than higher tax jurisdictions, such as Germany with its 30%-33% rates, or the US with its combined federal and state tax rates in the order of 40% (albeit Donald Trump is proposing to reduce federal taxes so that the combined rate would come down to around 20%). The UK will perhaps be in touching distance of Ireland with its comparatively low 12.5% rate.

However, a 5% cut in the corporate tax rate is going to cost a lot of money – at least £10 billion a year. Will we really make up for this through increased economy activity and encouraging businesses to invest in the UK?

Perhaps it will. A lower tax regime should encourage businesses to invest in the UK, shouldn’t it? And more investment should mean more jobs, more spending in the UK and and more profits, each generating taxes to offset the cost of the lower corporation tax rate.

But, and there is a but. This change will provide an incentive for international businesses to shift spending out of the UK and into higher tax jurisdictions.

This may sound counterintuitive, but remember that most investment and spending in the UK economy comes from businesses already operating in the UK and internationally. And for them the equation is a little different.

For example, take a business already operating in both the UK and Germany, paying taxes on its profits in each jurisdiction. The lower corporation tax rate will provide an incentive to increase profits in the UK and to decrease them in Germany.

The orthodox answer is to do what the government would like – to prioritise investment in the UK over Germany. But in reality, there is a much easier way to take advantage of this tax differential and that is to do the opposite – to increase spending in Germany and reduce spending in the UK.

After all, this would provide a 30% or so tax deduction on the additional German costs, at the cost of 15% on the higher profits it would generate in the UK – a 15% saving for each pound (or euro) of spending shifted over to Germany.

Of course, life is a bit more complicated than this simple example. In theory the international tax system of “transfer pricing” should offset this sort of cost shifting. But in reality, outside of a straightforward manufacturing or product business, it probably wouldn’t. Especially as this would not necessarily be a clearly linked event, perhaps not even a conscious decision. It would just make financial sense to prioritise cost cutting in the UK over cost cutting in Germany.

There are many arguments for lowering the corporation tax from its current level of 20%; not all of them about the effect on the public finances and on economic activity. Indeed, in years to come, a 20% rate may seem very high, just like the 52% rate that applied in the 1970s seems extremely high to us today. Arguably those historic rate reductions have generated positive returns to the economy, certainly in making the UK an attractive place to do business.

But, I do wonder. Are we getting to the point where cutting the rates below 20% will be effective at stimulating the economy or is this a case of diminishing returns?

Government needs to reverse the trend in infrastructure investment argues ICAEW

In a letter to the new Chancellor, Phillip Hammond, ICAEW has urged Government to take action urgently and reverse the trend by increasing investment in public infrastructure. It also calls for new fiscal rules to support greater private investment.

In its paper ‘Funding UK Infrastructure’, ICAEW argues that for all the new initiatives announced by Government in recent years, public investment in economic infrastructure appears to be static or declining until the end of the decade, while attempts to encourage greater private investment have not been successful. It also reveals:

  • private finance initiative (PFI) contracts have been drying up, with only £0.7bn of projects reaching financial closure during 2014-15
  • although the Government announced that the total National Infrastructure Pipeline had increased from £411bn in 2015 to £425.6bn in 2016, the near term profile of investment grew by less than the overall growth in the economy, with investment in energy infrastructure declining
  • investment in social infrastructure – schools, hospitals and housing – is also static or declining, with claimed increases in social housing investment being offset by expected reductions in capital spending by housing associations

Vernon Soare, ICAEW Chief Operating Officer and Executive Director, said:

“In the past we have seen too much talk and not enough action on infrastructure. The combination of a new Chancellor, low interest rates and Brexit means that now is the time for decisions to be taken and investment to be made. Wavering on projects such as a new runway in the south east of England and a lack of public investment have meant that we are not getting the economic benefits that infrastructure can generate. If Government leads the way, private investment will follow.”

The new Chancellor has already made the decision to change fiscal rules to permit borrowing to fund investment. However, priority now needs to be given to infrastructure investments that provide a positive return to the taxpayer and so pay for themselves, while PFI contracts need to be brought back onto the balance sheet so that they no longer bypass fiscal targets and can be properly evaluated based on whether they provide value for money to the taxpayer.

Vernon Soare adds: “With cost cutting and austerity only getting the UK so far, it is now necessary to generate revenue growth. That will require more investment in key infrastructure projects and spades in the ground. There is now the potential to use borrowing to fund an immediate increase in infrastructure investment.”

Click here to see the full report.

Pressure on public services – is it immigration or people living longer?

During the current EU debate a frequent complaint from the Leave side is about the pressure that immigrants put on public services, while the Remain side reply with economic studies indicating that immigrants pay more in taxes than they take out.

Both sides have a point – there are definitely more people living in the UK as a result of migration and so there should in theory be a greater demand on public services. However, it is also true that new migrants are typically young, in good health and generally here to work, likely to be putting more into the system than they take out.

But can it be as simple as just that?  We are also regularly informed that the biggest pressures on public services are coming from an increasingly older population, so which is it: immigration or growing older?

I thought I would start by looking at what has happened over the last twenty years, when the population has grown by seven million people, from 58 million people living in the UK in 1995 to 65 million in 2015.

Of that increase, four million is due to net migration and three million from natural changes. So there you have it, migration is more than half the increase.

But then I looked at how the increase splits between older and younger people, i.e. those older or younger than 40?  It turns out that over the last twenty years, the number of people aged over 40 has increased by six million, while the number of people under 40 has increased by only one million.

And how much of that six million increase in the over 40s is down to migration?  Amazingly, I discovered that the answer is (approximately) zero.  17 million people reached the age of 40 over that time, much more than the just over 11 million people who died, a net increase of six million due to natural changes.

Now, just to be clear, there has of course been immigration amongst the over 40s. But, the numbers suggest that they have either been here for 20 years or more or, if they arrived more recently, that there has been equal and offsetting emigration by Brits over 40 who have left the country to work or retire abroad. For the over 40s, net migration has been effectively nil over the last couple of decades.

But of course now I was puzzled.  Looking at the overall population it appears that more than half the growth is due to migration, but if I just looked at older people of 40 and over, I discover that 6 million of the increase out of 7 million (85%) comes from those older people, with zero migration involved.

This becomes clearer when we look at the younger age group. This has only increased by 1 million people from 32 million to 33 million, an increase of just 3% over the two decades, compared with the 12% increase in the total population.

Where has all the migration gone you ask? Well, it hasn’t gone; there definitely has been a net 4 million increase in the number of people aged under 40 as a consequence of migration. But, this has been mostly offset by a reduction of three million in the number of younger people through natural changes.

Looked at in this way, it appears that three million migrants have replaced younger workers in the economy, with only one million going towards the overall increase in the total population.

A contrasting picture, as shown in this handy chart:

Immigration UK 1995 to 2015

So what is the answer? Is the increased pressure on public services due to the four million migrants arriving here over the last 20 years net of departures. Or is it down to the 6 million extra older people, which would have happened anyway even if there hadn’t been any immigration?

A question that I will leave with you to ponder.