ICAEW chart of the week: The start of a new fiscal year

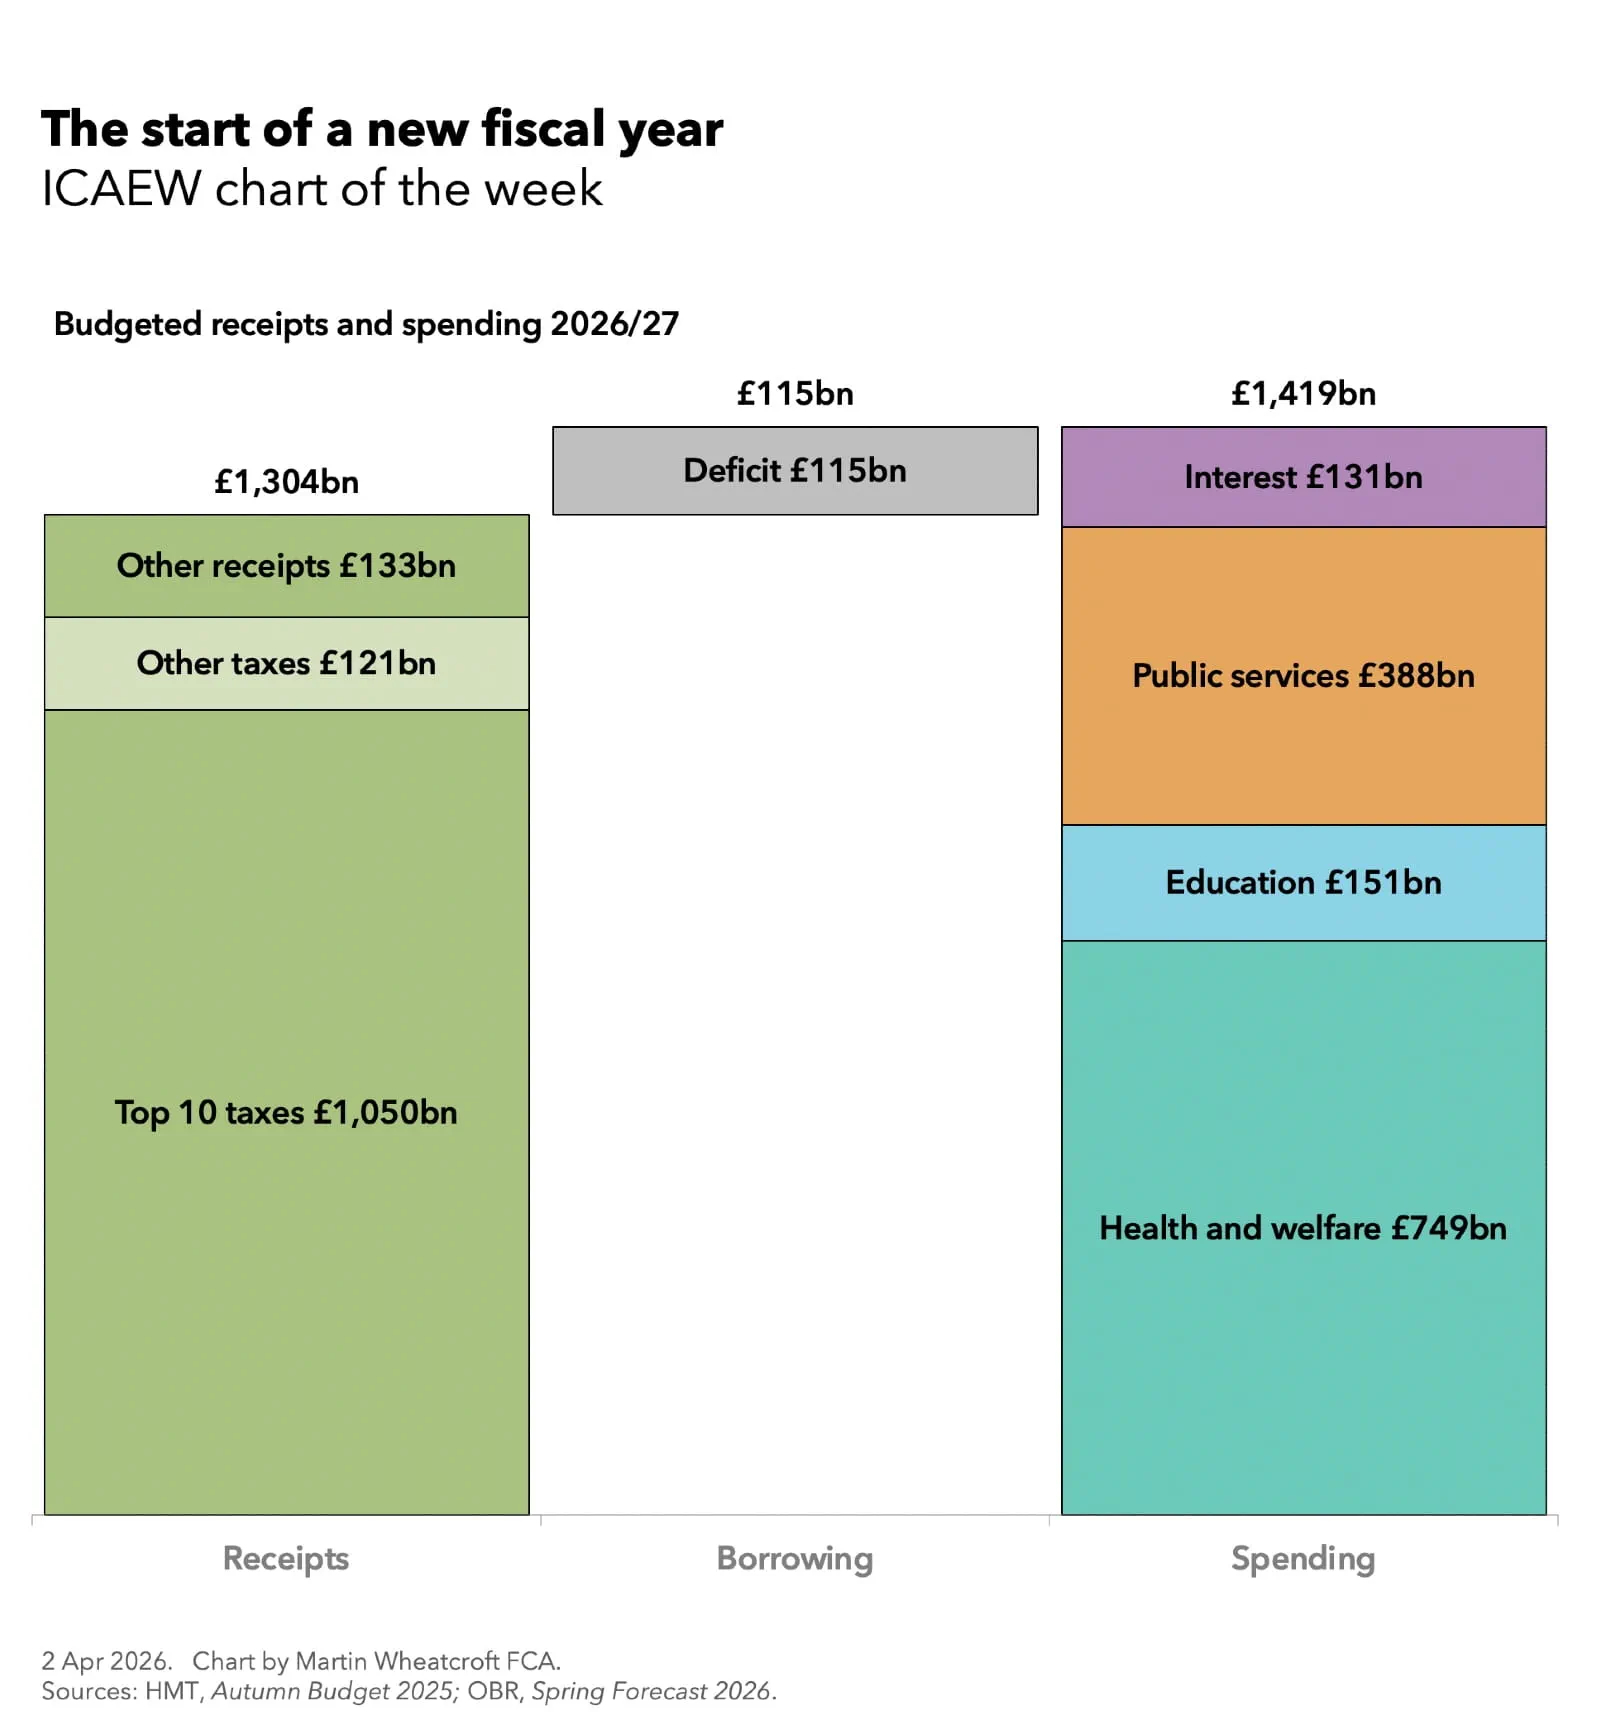
My first chart of the financial year starting 1 April 2026 for ICAEW looks at the government’s £1.4tn budget for 2026/27.
ICAEW chart of the week: The start of a new fiscal year. 

A step chart showing budgeted receipts and spending for 2026/27. 

Receipts £1,304bn = Top 10 taxes £1,050bn + Other taxes £121bn + Other receipts £133bn. 

Borrowing £115bn = deficit £115bn. 

Spending £1,419bn = Health and welfare £749bn + Education £151bn + Public services £388bn + Interest £131bn. 

2 Apr 2026. Chart by Martin Wheatcroft FCA. 
Sources: HMT, Autumn Budget 2025; OBR, Spring Forecast 2026.

My chart fir ICAEW this week is on the public sector budget for the 2026/27 financial year which began on 1 April 2026, showing how there is expected to be a shortfall of £116bn between anticipated receipts of £1,304bn and planned spending of £1,419bn.

This is equivalent to a deficit of 3.6% of GDP, calculated as receipts of 41.2% of GDP less total managed expenditure of 44.8% of GDP.

The chart highlights how the top 10 taxes are expected to generate £1,050bn (81% of total receipts), with all other taxes contributing £121bn (9%) and other receipts generating £133bn (10%). 

The top 10 taxes comprise: income tax which generates £360bn, VAT (£220bn), employer national insurance (£155bn), corporation tax (£102bn), employee and self-employed national insurance (£57bn), council tax (£54bn), business rates (£37bn), fuel duties (£24bn), capital gains tax (£21bn) and property transaction taxes (stamp duty in England) generating £20bn. 

The remaining £121bn of tax receipts comprises £84bn from the next 10 largest taxes: environmental duties (£16bn), alcohol duties (£13bn), vehicle excise duty (£10bn), inheritance tax (£9bn), insurance premium tax (£9bn), tobacco duties (£7bn), air passenger duty (£5bn), stamp duty on shares (£5bn), customs duties (£5bn) and the apprenticeship levy (£5bn), and £37bn from all other taxes and duties.

Other receipts comprise £87bn from operating surpluses (including social housing rents and the profits of public corporations), £43bn in interest and dividends (on investments and cash balances), and £3bn other receipts.

On the spending side, the chart illustrates how the £749bn budgeted for health and welfare is more than half of the total (approximately 53%), while education spending is budgeted to be £151bn (11%), public services outside of health, social care and education amount to £388bn (27%) and interest is forecast to be £131bn (9%).

Health and welfare spending comprises £401bn on welfare (including the state pension), £294bn on health (principally the NHS), and social care provision of £54bn. Budgeted spending on public services outside of health, social care and education include defence and security of around £70bn, transport £69bn, public order and safety £62bn, industry, agriculture and employment £56bn, and housing and environment £51bn, together with £80bn across the hundreds of other public services provided by central and local government.

The planned borrowing to fund the deficit of £116bn, the difference between receipts and total managed expenditure, excludes £15bn in other borrowing to fund government lending activities and working capital movements, with public sector net debt scheduled to rise above £3tn during the coming financial year. 

The problem for the Chancellor – and for all of us – is that the actual numbers for 2026/27 could be significantly worse from the budgeted amounts presented in our chart. Not only is she already under significant pressure to increase defence spending and alleviate student loans (amongst many other spending challenges), but the conflict with Iran will make the situation even more challenging for both the government and the nation.

On that cheery note, we would like to wish you all the best for the new (financial) year. 
This chart was originally published by ICAEW.

ICAEW chart of the week: Educational decline

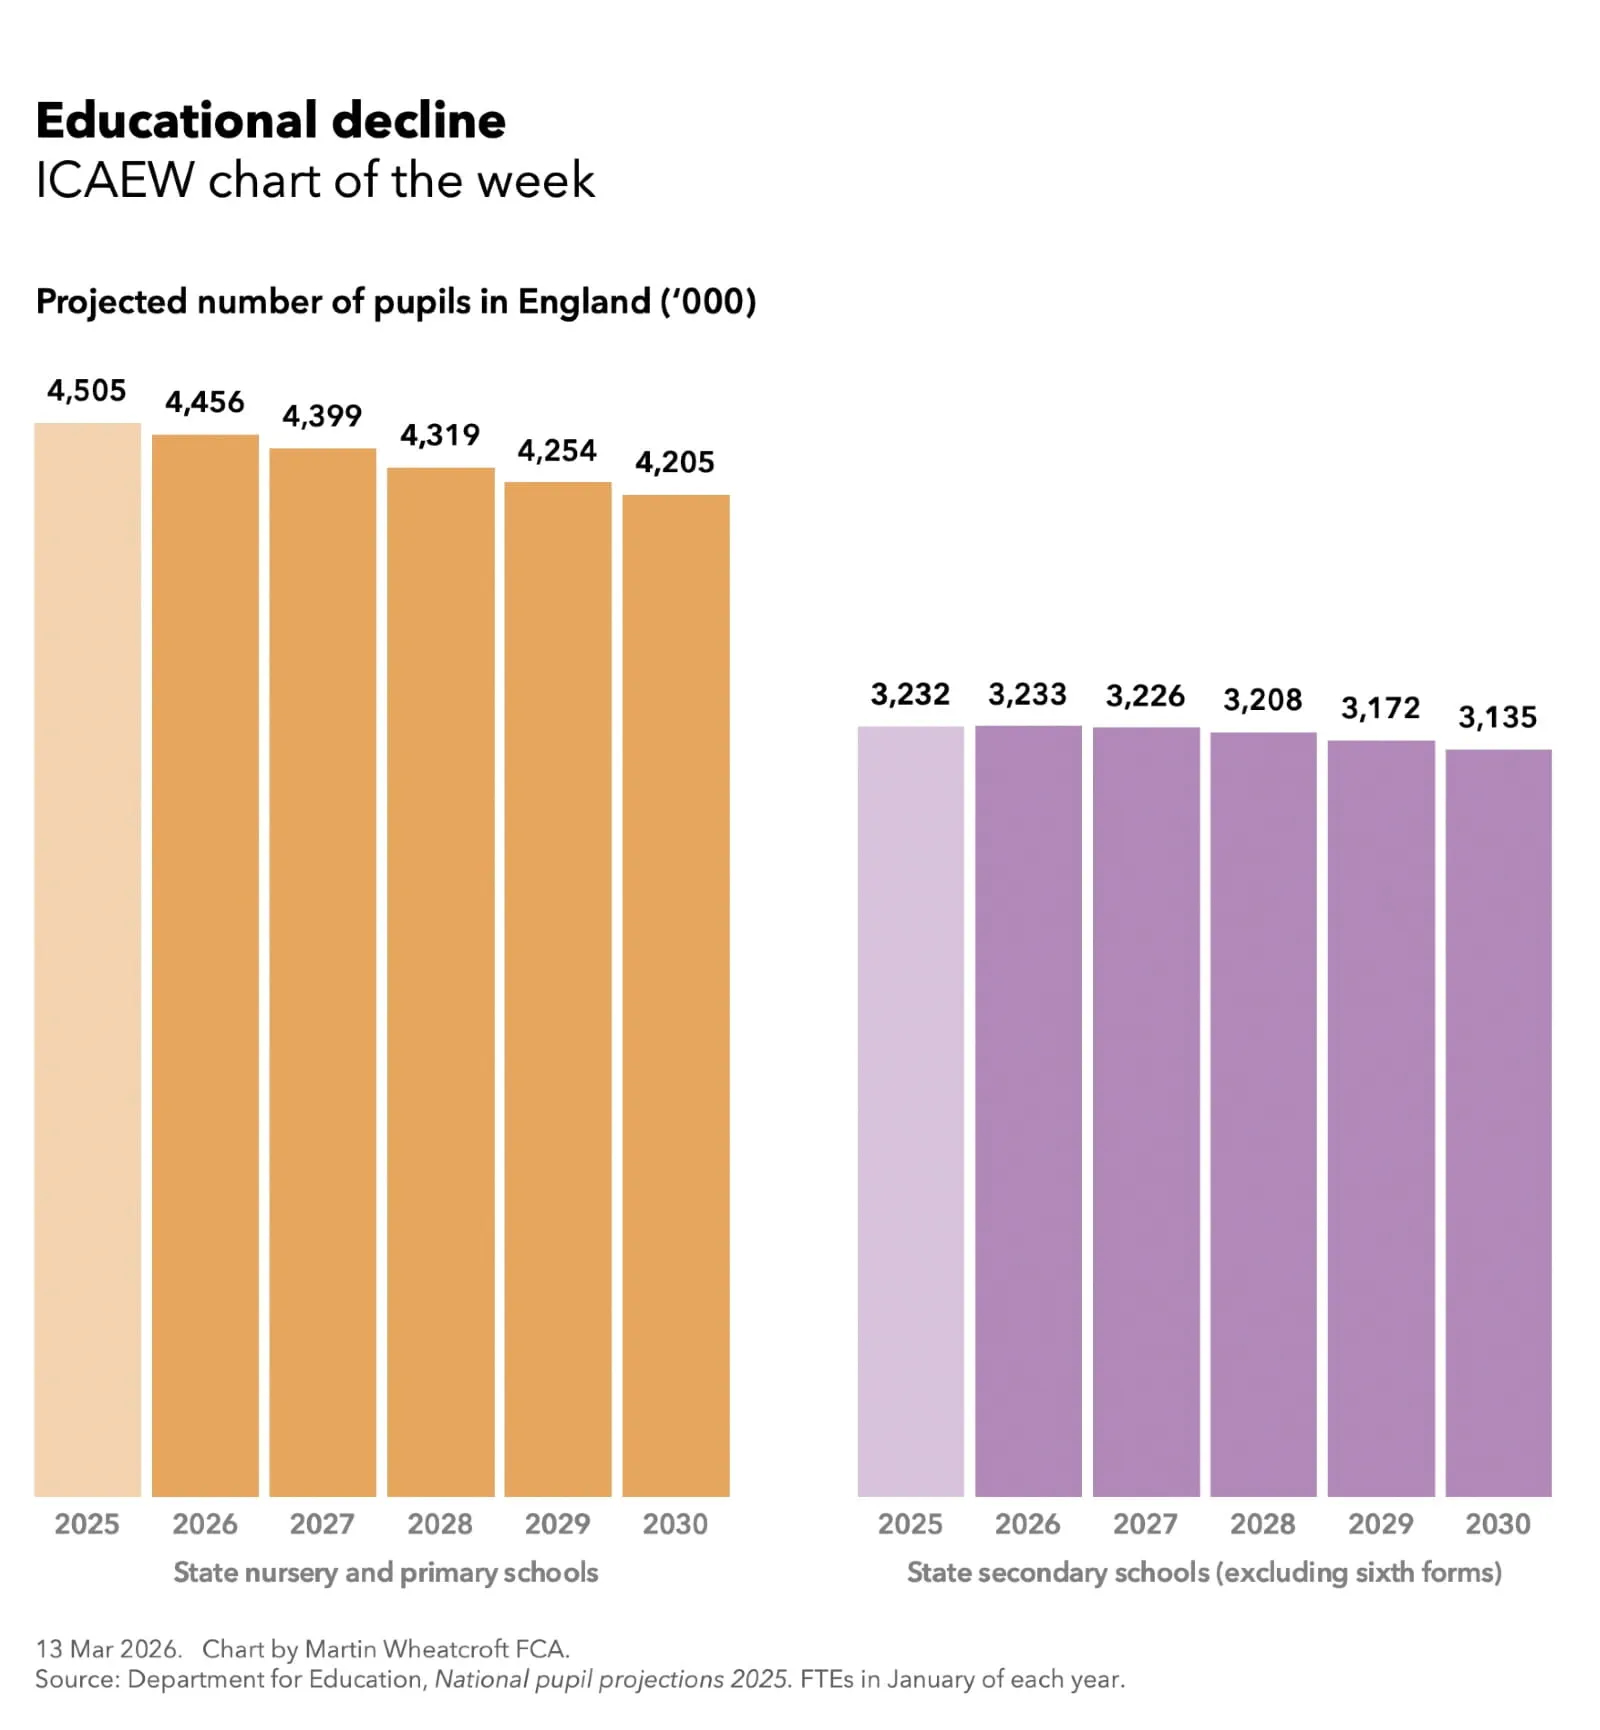
My chart for ICAEW this week looks at how school rolls in England are projected to decline by 7% in state nurseries and primaries and 3% in state secondaries over the next five years, and what that means for school closures and mergers across the country.

ICAEW chart of the week: Educational decline. 

Twin column charts showing the projected number of pupils in England (in thousands) between 2025 and 2030. 

State nursery and primary schools" 4,505 in 2025, 4,456, 4,399, 4,319, 4,252 and 4,205 in 2030. 

State secondary schools (excluding six forms): 3,232, 3,233, 3,226, 3,208, 3,172 and 3,135 in 2030. 

13 Mar 2025. Chart by Martin Wheatcroft FCA. 
Source: Department for Education, National pupil projections 2025. FTEs in January of each year.

According to Department for Education statistics, there were 8,384,000 school pupils under the age of 16 in England in January 2025 (ages recorded as of 31 August 2024). Of these, 4,505,000 were in maintained nursery and state primary schools, 3,232,000 were in state secondary schools, 146,000 were in state special schools, 482,000 were in independent schools and 16,000 were in alternative provision.

My chart for ICAEW this week shows how the largest two categories of schools are projected to change over the next five years, starting with a projected 7% fall in pupil numbers in state nursery and primary schools from 4,505,000 in the last academic year to 4,205,000 in 2030. This follows a decline of 3% since 2019 when state nursery and primary numbers peaked at 4,652,000.

Meanwhile the number of state secondary school pupils under the age of 16 at the start of the academic year is expected to decline from 3,322,000 in January 2025 to 3,135,000 in January 2030, a fall of 3% from the peak.

Driven by a falling birthrate, the 7% projected fall in state nursery and primary school pupils is likely to be a political hot potato for local authorities and government in the face of what is likely to be a large number of ‘save our local school’ campaigns. London has already seen a significant number of primary school closures over the past five years, but the further drop projected is likely to see most parts of the country affected to a greater or lesser extent.

The 3% decline from the peak in secondary school pupil numbers will also present challenges, especially as the fall in numbers is unlikely to be spread evenly across the country. Some will see smaller falls or even rises in their school rolls, while others will see a much greater drop in their intakes. Reducing the number of classes in each year is a likely response for some schools, but entire school closures and mergers are almost inevitable.

The core of the projections is the provision of school places for children who are already in the education system or have already been born, but uncertainties about the rapidly falling birth rate meant that the Department for Education limited their projections to five years instead of their traditional ten-year outlook. With these projections, the main uncertainty is in the level of migration, with government actions to restrict legal immigration likely to see the next projections revised down even further when they are released this summer.

In theory, falling school rolls should reduce pressures on the education budget while at the same time potentially increasing per pupil funding. In practice, pressures on the public finances are so large that the government is likely to be looking for every saving they can find.

This chart was originally published by ICAEW.

ICAEW chart of the week: Student loans

My chart for ICAEW this week looks at how the Department for Education has impaired 40% of the value of its student loans outstanding as at 31 March 2025.

This is before taking account of the government’s decision to freeze repayment thresholds over the next three years, which should reduce the impairment to 38%.

According to the Department for Education’s consolidated annual report and accounts 2024/25, the face value of student loans in England increased from £234bn to £265bn during the year ended 31 March 2025. The movements comprised £21bn in new loans advanced to students during the year and £15bn of added interest less £5bn in repayments.

As our chart also illustrates, the carrying value in the department’s balance sheet increased from £151bn to £158bn, once an impairment of £24bn during the year is taken into account – increasing the cumulative impairment from £83bn to £107bn.

This is an increase in the impairment percentage from approximately 35% on 31 March 2024 to 40% on 31 March 2025 based on the fair value of the student loan portfolio calculated by the department.

The £21bn impairment can be analysed between an immediate £6bn impairment on the inception of new loans issued during the year (approximately 30% of their face value) and £15bn from the recalculation of the fair value of loans at the end of the financial year, co-incidentally pretty much offsetting the interest added to the loans. 

The loan portfolio can be broken down between Plan 1 loans for undergraduate courses that started before 1 September 2012 (face value £28bn less £14bn cumulative impairment = fair value £12bn on 31 March 2025), Plan 2 loans for undergraduate courses between 2012 and 31 August 2023 (£216bn – £87bn = £129bn), Plan 3 loans for postgraduates (£7bn – £1bn = £6bn) and Plan 5 loans for undergraduate courses starting from 1 September 2023 onwards (£14bn – £3bn = £11bn).

The recent controversy around student loans has been around the interest rates charged on student loans, and in particular those of Plan 2 loans owed by the majority of former students, which are based on RPI + 3%. In the year from 1 September 2025 the interest rate is 6.2% for those earning £51,245 (£4,270 a month) or more reducing to 3.2% for those earning £28,470 (£2,372 a month) or less. 

This often means that the balance outstanding grows by more than the amount repaid. For example, someone earning £42,000 (£3,500 a month) with Plan 2 student loans totalling £50,000 on 1 September 2025 would see £2,490 (at an interest rate fractionally under 5%) added to their loan over the year to 31 August 2026. As their repayments would be equal to approximately £1,220 (being 9% on their earnings above the Plan 2 threshold of £28,470) their debt would rise to £51,270.

Most current undergraduates are under Plan 5, which has a flat interest rate of RPI irrespective on income but a lower £25,000 repayment threshold which could see them pay a lot more over their 40-year terms than those on the 30-year Plan 2 loans. In our example, a graduate on £42,000 a year with £50,000 in Plan 5 loans brought forward would see £1,600 added in interest and repay £1,530 to result in a much smaller increase in their outstanding loan balance.

With the government suggesting that they are going to have another look at the way student loans are designed, many graduates will be hoping that reform is the air.