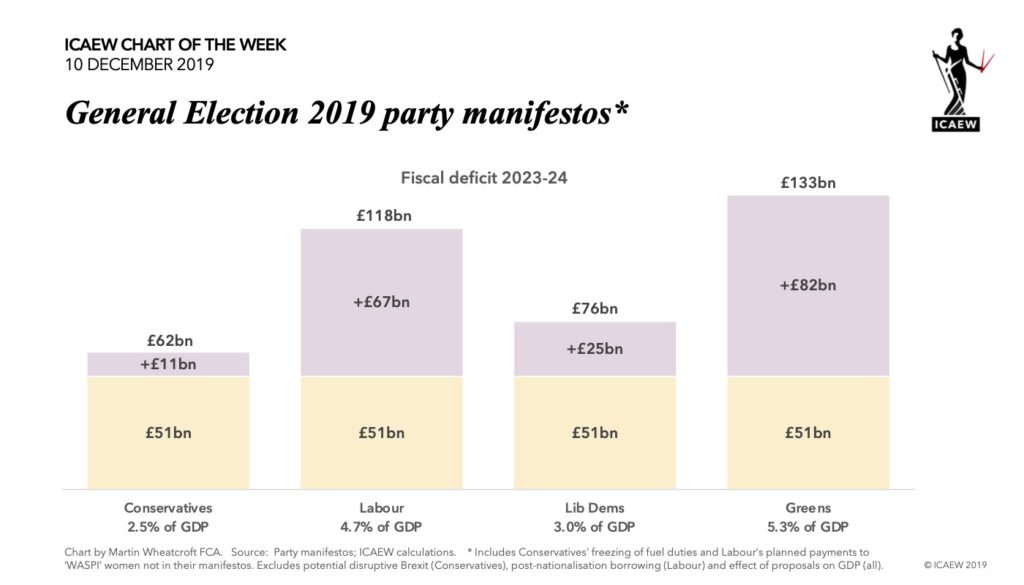
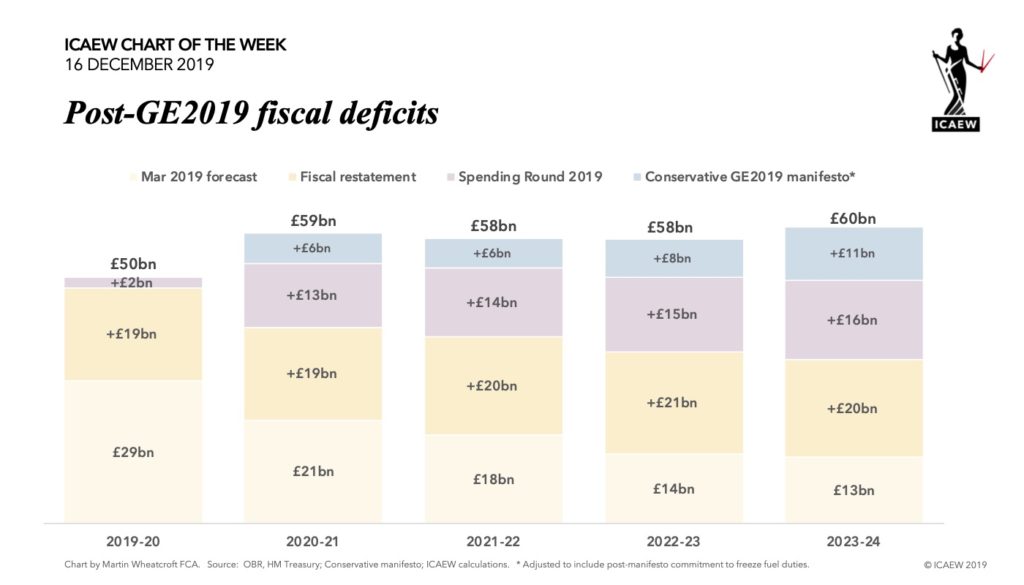
ICAEW chart of the week: OBR forecast revisions UPDATED FOR SPRING STATEMENT

Following the Spring Statement earlier today, we have updated our ICAEW chart of the week to reflect the changes in the official forecasts made by the Office for Budget Responsibility.

Rumours that the Chancellor would benefit from a ‘windfall’ in the form of higher than expected tax revenues turned out to be true, but only to a very modest extent. Overall, there was an average revenue uplift of £3.5bn per year over the forecast period, before taking into account some small tax increases of £0.8bn per year (most of which is for probate fees and the immigration health surcharge).

We were therefore quite right not to get carried away, as our updated ICAEW chart of the week is hardly changed from the previous version (see below).

The forecast for taxes and other income for 2019-20, the financial year about to start, has been increased by £1.6bn from the previous forecast presented with the Autumn Budget 2018. This comprises a revision to the revenue forecasts by the OBR of £1.0bn and a further £0.6bn from the consequence of government decisions (principally tax increases). 

As a consequence, the new forecast for current receipts of £811.4bn for 2019-20 is still £5.9bn below the position that Philip Hammond inherited.

Of course, the big concern overshadowing the Spring Statement was Brexit, with the Chancellor caveating pretty much everything he said, in particular on his proposed plans for future spending. 

This small upward revision (0.1%) in projected revenues was no doubt better for the Chancellor than a downward revision, but it won’t have done much to improve his mood after all.

See below for the original blog post:

The Spring Statement is this Wednesday, and there have been rumours that the Chancellor may benefit from a ‘windfall’ in the form of higher than expected tax revenues.

However, before getting carried away in giddy excitement by this prospect, we thought it might be worthwhile for our ICAEW chart of the week to look at what has happened to the Office for Budget Responsibility’s financial projections since Philip Hammond became Chancellor.

These projections cover multiple years, but for this purpose we have chosen to look at the forecast for taxes and other income for coming financial year. Back in 2016, the Chancellor inherited a forecast of £820.9bn for government revenue in 2019-20, although there have been some accounting and classification changes since then that means this is equivalent to a baseline forecast of £816.7bn (after also taking into account some modest net tax increases). 

As the latest forecast from the Autumn Budget last year is for current receipts to be £809.8bn in 2019-20, there is still a £6.9bn shortfall compared with the position that Philip Hammond inherited.

Of course, the Chancellor and the OBR had very good reasons to be cautious in 2016. The UK had just voted to leave the European Union and it was unclear as to what this might mean for the economy (plus ça change), while productivity growth remained stubbornly weak. A small upward revision in  March 2017 was followed by another downward revision in the November 2017 forecast, driven by even more pessimistic views on productivity.

These forecast downgrades in 2016 and 2017 have underpinned a generally gloomy Hammond Chancellorship, but he was marginally more cheerful in the last two fiscal events as upward revisions to the forecasts gave him some room to increase spending without adding further to borrowing.

Will the OBR be able to put a smile on the Chancellor’s face on Wednesday with a further upward revision to projected revenues? We look forward to finding out.

ICAEW chart of the week: UK GDP over the last two decades

The ICAEW chart of the week this time is on the size of the UK economy over the last couple of decades.

According to the Office for Budget Responsibility, economic activity in the UK is forecast to add up to £2,126bn for the year ending 31 March 2019, an average increase of 3.1% a year over the £1,564bn reported a decade earlier.

Excluding inflation of 1.66% per annum, this means economic growth has averaged 1.44% over the last ten years since the financial crisis. This is significantly lower than economic growth in the decade before the the financial crisis of 2.32%, as well as the average of 2.45% seen in the 30 years up to 1998-99.

Some economists are suggesting that low rates of growth may be a ‘new normal’ and that we should not expect a return to previous levels. If so, there will be significant implications for how the government manages the public finances, with reduced future revenues available to fund growing public liabilities and financial commitments such as the state pension.

Another reason perhaps to re-evaluate the ‘pay-as-you-go’ assumption that underpins the government’s long-term strategy for the public finances? 

ICAEW chart of the week: A resurgence of Quangos?

Who else remembers the great bonfire of the Quangos? It doesn’t seem too long ago that the government was busy abolishing or privatising as many Quangos (quasi-autonomous governmental organisations) as they could track down. A determined effort to cut back the tangled weeds of bureaucracy that had grown up over decades of government expansion.

However, in recent years this particular garden appears to have gone untended and the weeds seem to be making a comeback!

This week’s ICAEW #chartoftheweek highlights how according to gov.uk there has been a 14% increase in the number of government bodies over the last four years, with the website listing 541 government departments, government agencies and other public bodies, high profile groups, and public corporations in January 2019.

Of course, counting up the number of organisations listed on the main government website is unlikely to give a full picture of what is going on. After all, public bodies can range in size from small advisory committees up to large agencies with multi-billion pound budgets, often containing a number of subsidiary organisations not included in the main list. However, despite that, it does look like that Quangos are making a resurgence, with a range of new bodies set up in the last few years.

As any gardener will tell you, it is important not to leave weeding for too long if you don’t want your garden to become overrun and unmanageable. Time to get the wellies on and head outdoors again?

ICAEW chart of the week: UK international trade

For some reason the UK’s international trade arrangements with other countries are a continuing topic of debate, and so we turn to imports and exports for this week’s ICAEW #chartoftheweek.

According to provisional numbers from the Office for National Statistics published last week, imports of goods and services are estimated to have been in the order of £660bn in 2018, while exports were around £630bn, a net trade deficit of £30bn. This comprises a deficit on goods of £140bn (imports of £490bn versus exports of £350bn) and a surplus on services of £110bn (imports of £170bn compared with exports of £280bn).

The largest proportion of the UK’s trade is with the EU, comprising around 55% of imports and 45% of exports. Within the EU, Germany is the  (imports of £85bn and exports of £58bn), followed by the Netherlands (£48bn and £36bn), France (£43bn and £40bn), Ireland (£24bn and £31bn), Spain (£32bn and £17bn), Belgium (£30bn and £19bn) and Italy (£26bn and £20bn).

The US, still the largest economy in the world, is the UK’s largest individual trading partner, with the UK importing goods and services in the order of £75bn from, and exporting £117bn to, the US in 2018. The next largest trading partner outside the EU is China, with imports of £58bn and exports of £30bn.

With the UK scheduled to depart the EU in less than 40 days’ time, there is still a great deal of uncertainty as to what the UK’s post-Brexit trade arrangements will be – and hence the potential effect on international trade from April onwards.

ICAEW chart of the week: UK railway finances

This week’s #ICAEWchartoftheweek is on the UK rail industry’s finances for 2018-18, the subject of a recent report by the Office of Rail and Road.

Although the ORR tries to explain the way money flows through the industry (see below), with payments to and from the different players, we thought we would try and provide a high level overview that summarises the £20.5bn needed in total by the railways last year.

Broadly the train operating companies and Network Rail together generated £12.4bn in revenue, of which £9.8bn came from passenger fares. This is 60% of the total, with taxpayers contributing the balance of £8.1bn (40%) in the form of subsidies, public borrowing and losses by the state-owned Network Rail. 

This was used to fund £10.8bn in train company and Network Rail operational costs, £7.7bn in Network Rail capital expenditure and rolling stock leases, and £2.0bn in Network Rail debt interest. (This does not include the £1bn or so incurred in 2017-18 by the Department for Transport on the new HS2 line between London and Birmingham.)

With fares continuing to rise ahead of inflation, high levels of passenger dissatisfaction, and precarious finances, the railways are likely to continue to depend on government support for the foreseeable future.

ICAEW chart of the week: UK Defence Equipment Plan

A scathing report on the UK Defence Equipment Plan released last week by the Public Accounts Committee provides the subject matter for the #ICAEWchartoftheweek. This follows on from a National Audit Office review of the Ministry of Defence’s plans to spend £186bn on equipment between 2018 and 2028 and the prospect of £7bn to £15bn of overruns. 

We looked at this as part of the IFS Green Budget 2018 in a chapter on defence finances. This highlighted how the long-term decline in defence and security spending is at an end as it gets close to the 2.0% minimum NATO commitment, as well as the challenges in improving financial management within the MoD.

As our chapter concluded, the strategic choice for the UK is to match its aspirations for a global military role to the amount it is willing to spend on defence. We are still waiting for the Spending Review to see what the Government decides.

ICAEW on Defence in the IFS Green Budget 2018 – https://www.ifs.org.uk/publications/13493

Public Accounts Committee report on the Defence Equipment Plan – https://www.parliament.uk/business/committees/committees-a-z/commons-select/public-accounts-committee/news-parliament-2017/mod-equipment-plan-report-publication-17-19/

National Audit Office report on the Defence Equipment Plan – https://www.nao.org.uk/report/the-equipment-plan-2018-to-2028/

ICAEW chart of the week: UK workforce statistics

The good news from the ONS last week is that the unemployment rate is down and the employment rate is up. 

But, while the trends are encouraging, the statistics are a little confusing. After all, why does unemployment of 4.0% plus employment of 75.8% not add up to 100%? 

We delve into the mysterious world of UK workforce statistics for the #ICAEWchartoftheweek.

Let’s start with the unemployment rate, which excludes 19.26m ‘economically inactive’ individuals from the calculation. These comprise 11.73m in retirement, 2.27m students, 2.05m homemakers, 1.98m long-term ill and 1.23m not working for other reasons.

The employment rate calculation includes most of these, but not 11.90m people aged 65 or more (1.28m of whom are in work). On this basis the rates do add up to 100%, with employment of 75.8%, unemployment of 4.2% and economically inactive of 21.0%.

One mystery solved, but another is why the ONS don’t publish the share of those in work out of the total population? We estimate this to be 48.9%, meaning that less than half of all people living in the UK are actually in employment.  

This seems to us to be extremely important to know given the increasing pressures being placed on the public finances as more people live longer.

ICAEW chart of the week: EU budget 2019

The #ICAEWchartoftheweek this time is on the subject of the EU’s 2019 budget of €148bn. This is in the order of £130bn at current exchange rates, equivalent to €24 per month for each of the 514m people in the EU. 

Of this, €10bn is for EU institutions, with €25bn to be incurred on its main programmes. The big numbers are €57bn for agriculture and rural communities, and €47bn for economic development. A further €9bn is planned in international aid outside the EU.

Not shown in the chart is an increase in future commitments of €18bn – amounts authorised but not yet paid out, such as multi-year research or development grants.

The UK’s share for 2019 is £15bn, but with £6bn expected to come back, the net cost should be £9bn (£11 per person per month), just over 1% of planned UK government spending in 2019-20 of £842bn.

What will happen if the UK’s agreed transition period contributions of £16bn in 2019 and 2020 and post-transition payments of £21bn are not paid in full? Although the UK is expected to prepay around £3bn before the end of March (not included in the £16bn), that will only last so long if it leaves without a deal.

One certainty is that the finance team at the European Commission will need a full range of scenario planning skills to deal with all the possibilities.

ICAEW chart of the week: Austerity in English local authorities

The news of the proposed appointment of Gareth Davies to be the new Comptroller & Auditor General for the UK prompted us to look at the National Audit Office website. There we saw one of its current highlights – a fascinating set of data visualisations derived from a major report published last year on the financial sustainability of local authorities in England.

This has inspired this week’s ICAEW #chartoftheweek, which illustrates just how significantly local government spending has been cut in recent years. Annual net expenditure by English local authorities has fallen by £7.0bn or 16% from £43.7bn in 2010-11 (in 2016-17 prices) to £36.7bn in 2016-17.

Spending on planning and development is less than half what it was, while spending on housing support has almost halved. Budgets for transport (highways and public transport) and culture (including libraries, open spaces, sport and tourism) have been cut by over a third, while spending on waste collection, environmental regulation and administration have also been cut. While spending on adult social care is ‘only’ down by 6%, this conceal a much more dramatic cutback in services given the significant growth in the number of older people needing care. Only children’s social care has increased by more than inflation, and then only slightly.

With reports that more and more local authorities are struggling financially, there are many questions to ask about this often neglected area of the public finances.

We look forward to hearing what areas Gareth Davies will be exploring in his tenure. We hope that he will build on the legacy of the current C&AG Sir Amyas Morse to drive improvements in the public finances on behalf of the citizens of the UK.

To find out more, visit the NAO website for more data visualisations on the financial sustainability of English local government – https://www.nao.org.uk/highlights/financial-sustainability-of-local-authorities-2018-visualisation/.

To comment on this, visit ICAEW Talk Accountancy blog at https://ion.icaew.com/talkaccountancy/b/weblog/posts/chartoftheweek062

ICAEW chart of the week: The global economy in 2019

The first ICAEW #chartoftheweek for 2019 is on the subject of the global economy, with GDP forecast to add up to £69tn in 2019 based on data provided by the IMF.

The UK is expected to generate £2.2tn in economic activity in 2019, just over 3% of the world total. This reflects the UK’s position as a relatively rich country given that its 67m people make up less than 1% of the global population of 7.6bn.

Sterling weakness means that the UK is expected to be only the seventh largest economy in 2019, behind the US (£17.7tn), China (£11.3tn), Japan (£4.1tn), Germany (£3.2tn), India (£2.4tn) and France (£2.2tn). However, it should still be significantly ahead of Italy (£1.7tn), Brazil (£1.5tn), South Korea (£1.3tn), Canada (£1.3tn), Russia (£1.2tn), Spain (£1.1tn), Australia (£1.1tn) and Mexico (£1.0tn).

With Brexit scheduled for the end of Q1 and the potential for escalation in the US’s trade wars with China, Japan and the EU, is a world of strong economies possible in 2019? The only certainty is uncertainty.

However, despite the potentially stormy economic conditions ahead, we remain optimistic for the future. Poverty continues to fall around the world, and new innovations continue to improve the lives of billions of people.

And with that more cheery note, we wish you all the best for the coming year.