ICAEW chart of the week: Home living

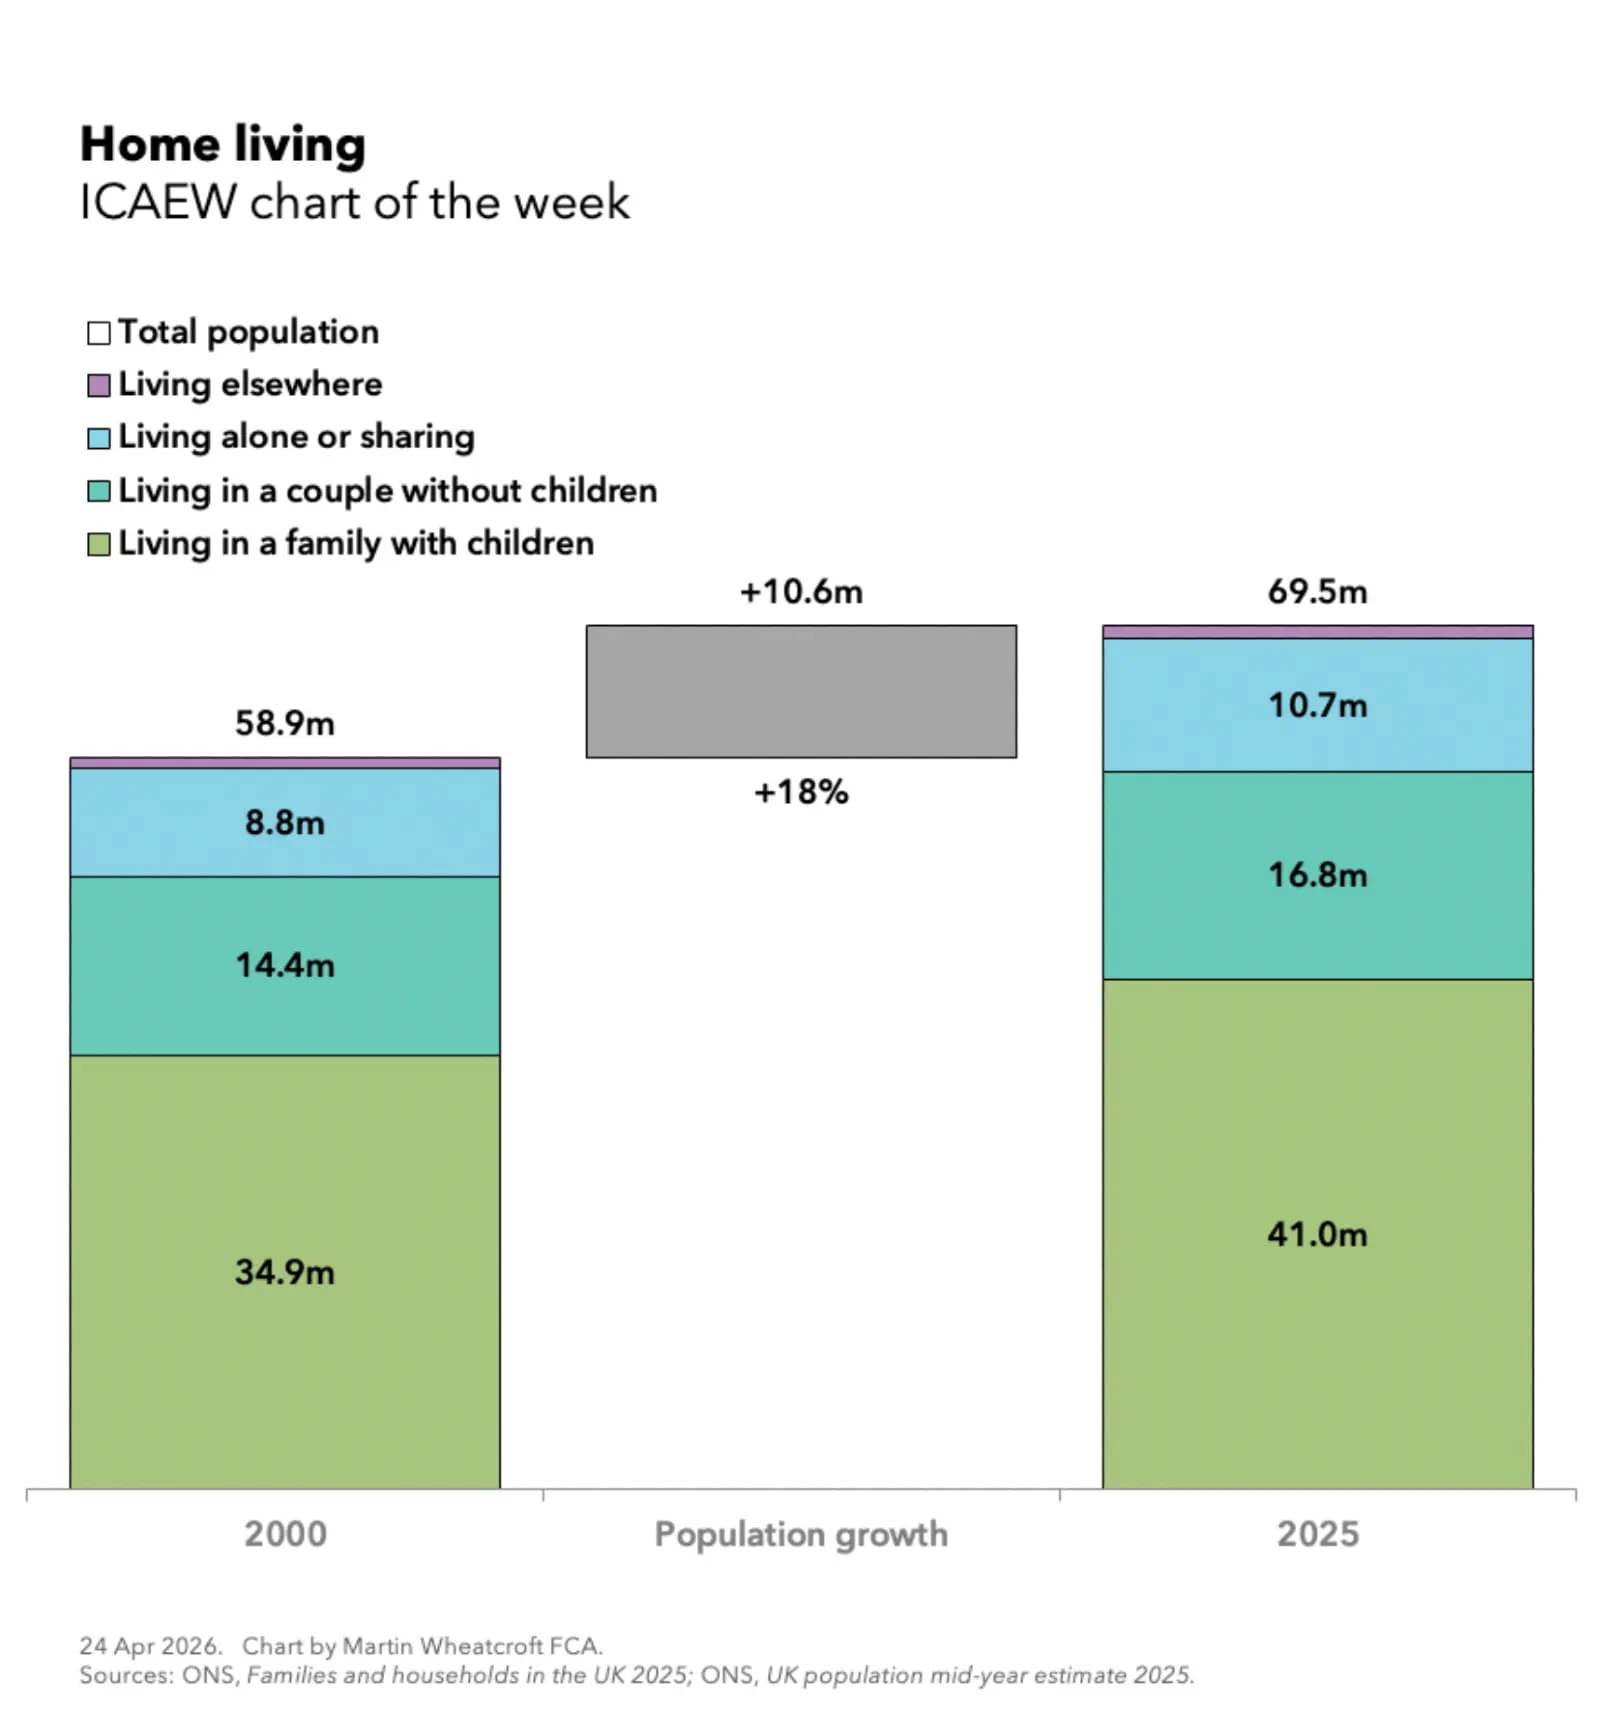
My chart for ICAEW this week is on how people in the UK still live in broadly the same type of households as they did 25 years ago, despite the population growing by 18% over that time.
ICAEW chart of the week: Home living. 

A step-chart showing 58.9m population in 2000 + 10.6m population growth (+18%) = 69.5m population in 2025. 

Living in a family with children: 34.9m in 2000, 41.0m in 2025. 

Living in a couple without children: 14.4m in 2000, 16.8m in 2025. 

Living alone or sharing: 8.8m in 2000, 10.7m in 2025. 

Living elsewhere (labels not shown): 0.8m in 2000, 1.0m in 2025. 

24 Apr 2026. Chart by Martin Wheatcroft FCA. 
Sources: ONS, Families and households in the UK 2025; ONS, UK population mid-year estimate 2025.

My chart of the week for ICAEW is on the composition of households in the UK in 2025 and how they compare with the start of the century.

According to the Office for National Statistics (ONS), the total population of the UK in 2000 was 58.9m people, increasing by 10.6m or 18% to 69.5m people in 2025. The ONS also analyses the different types of family groupings for the 58.1m people living in households in 2000 and 68.5m in 2025.

As the chart illustrates, the 34.9m people living as part of a family with children or in multi-family households in 2000 rose by just over 17% to 41.0m in 2025, while the 14.4m people living as part of couples with no children in 2000 increased by just under 17% to 16.8m in 2025. The 8.8m people living alone or sharing with unrelated adults in 2000 increased by 22% to 10.7m while the number of people living elsewhere (generally in community establishments) rose by 0.8m people in 2000 to 1.0m in 2025.

The 34.9m and 41.0m people living as part of a family with children or in multi-family houses in 2000 and 2025 respectively can be analysed between 17.0m and 20.2m living in households headed by a couple with one or two dependent children, 5.5m and 5.0m headed by couples with three or more dependent children, 5.2m and 6.3m headed by couples with non-dependent children only, 6.3m and 8.2m in families headed by lone parents, and 0.9m and 1.3m in multi-family households.

The 8.8m and 10.7m people living alone or sharing in 2000 and 2025 comprise 7.0m and 8.6m living alone and 1.8m and 2.1m sharing with unrelated adults.

The ONS does not give an analysis of the 0.8m and 1.0m living elsewhere in 2000 and 2025, but data from the 2021 census for England and Wales suggests that approaching half live in educational accommodation (student halls and boarding schools) and around a third live in care homes, with the balance in prisons, on military bases, in temporary accommodation, in hospitals, and within religious establishments among other types of accommodation.

Analysing the changes

As a proportion of the total, there has been a 0.4 percentage point decline in the proportion of people living as part of a family with children from 59.4% to 59.0% over the last 25 years and a 0.3 percentage point decrease in the proportion living in couples without children from 24.4% to 24.1%. Meanwhile, the proportion living alone or sharing increased by 0.5 percentage points from 14.9% to 15.4% and the proportion living elsewhere increased by 0.2 percentage points from 1.3% to 1.5%.

Within these categories there were some bigger demographic shifts, reflecting a falling birth rate and people living longer, diverging from the 18% increase in the size of the overall population over 25 years. These include a 9% drop in the number of people living in couple households with three or more dependent children, from 5.5m in 2000 to 5.0m in 2025; a 30% increase in the number of people over the age of 65 living alone, from 3.3m in 2025 to 4.3m in 2025; and a 30% increase in the number of lone parent families, from 6.3m to 8.2m, with the latter driven by a 77% increase in the number of lone-parent families with non-dependent children only from 1.6m to 2.8m.

So, while the overall picture hasn’t changed that dramatically, there is a lot going on under the surface.
This chart was originally published by ICAEW.

ICAEW chart of the week: Educational decline

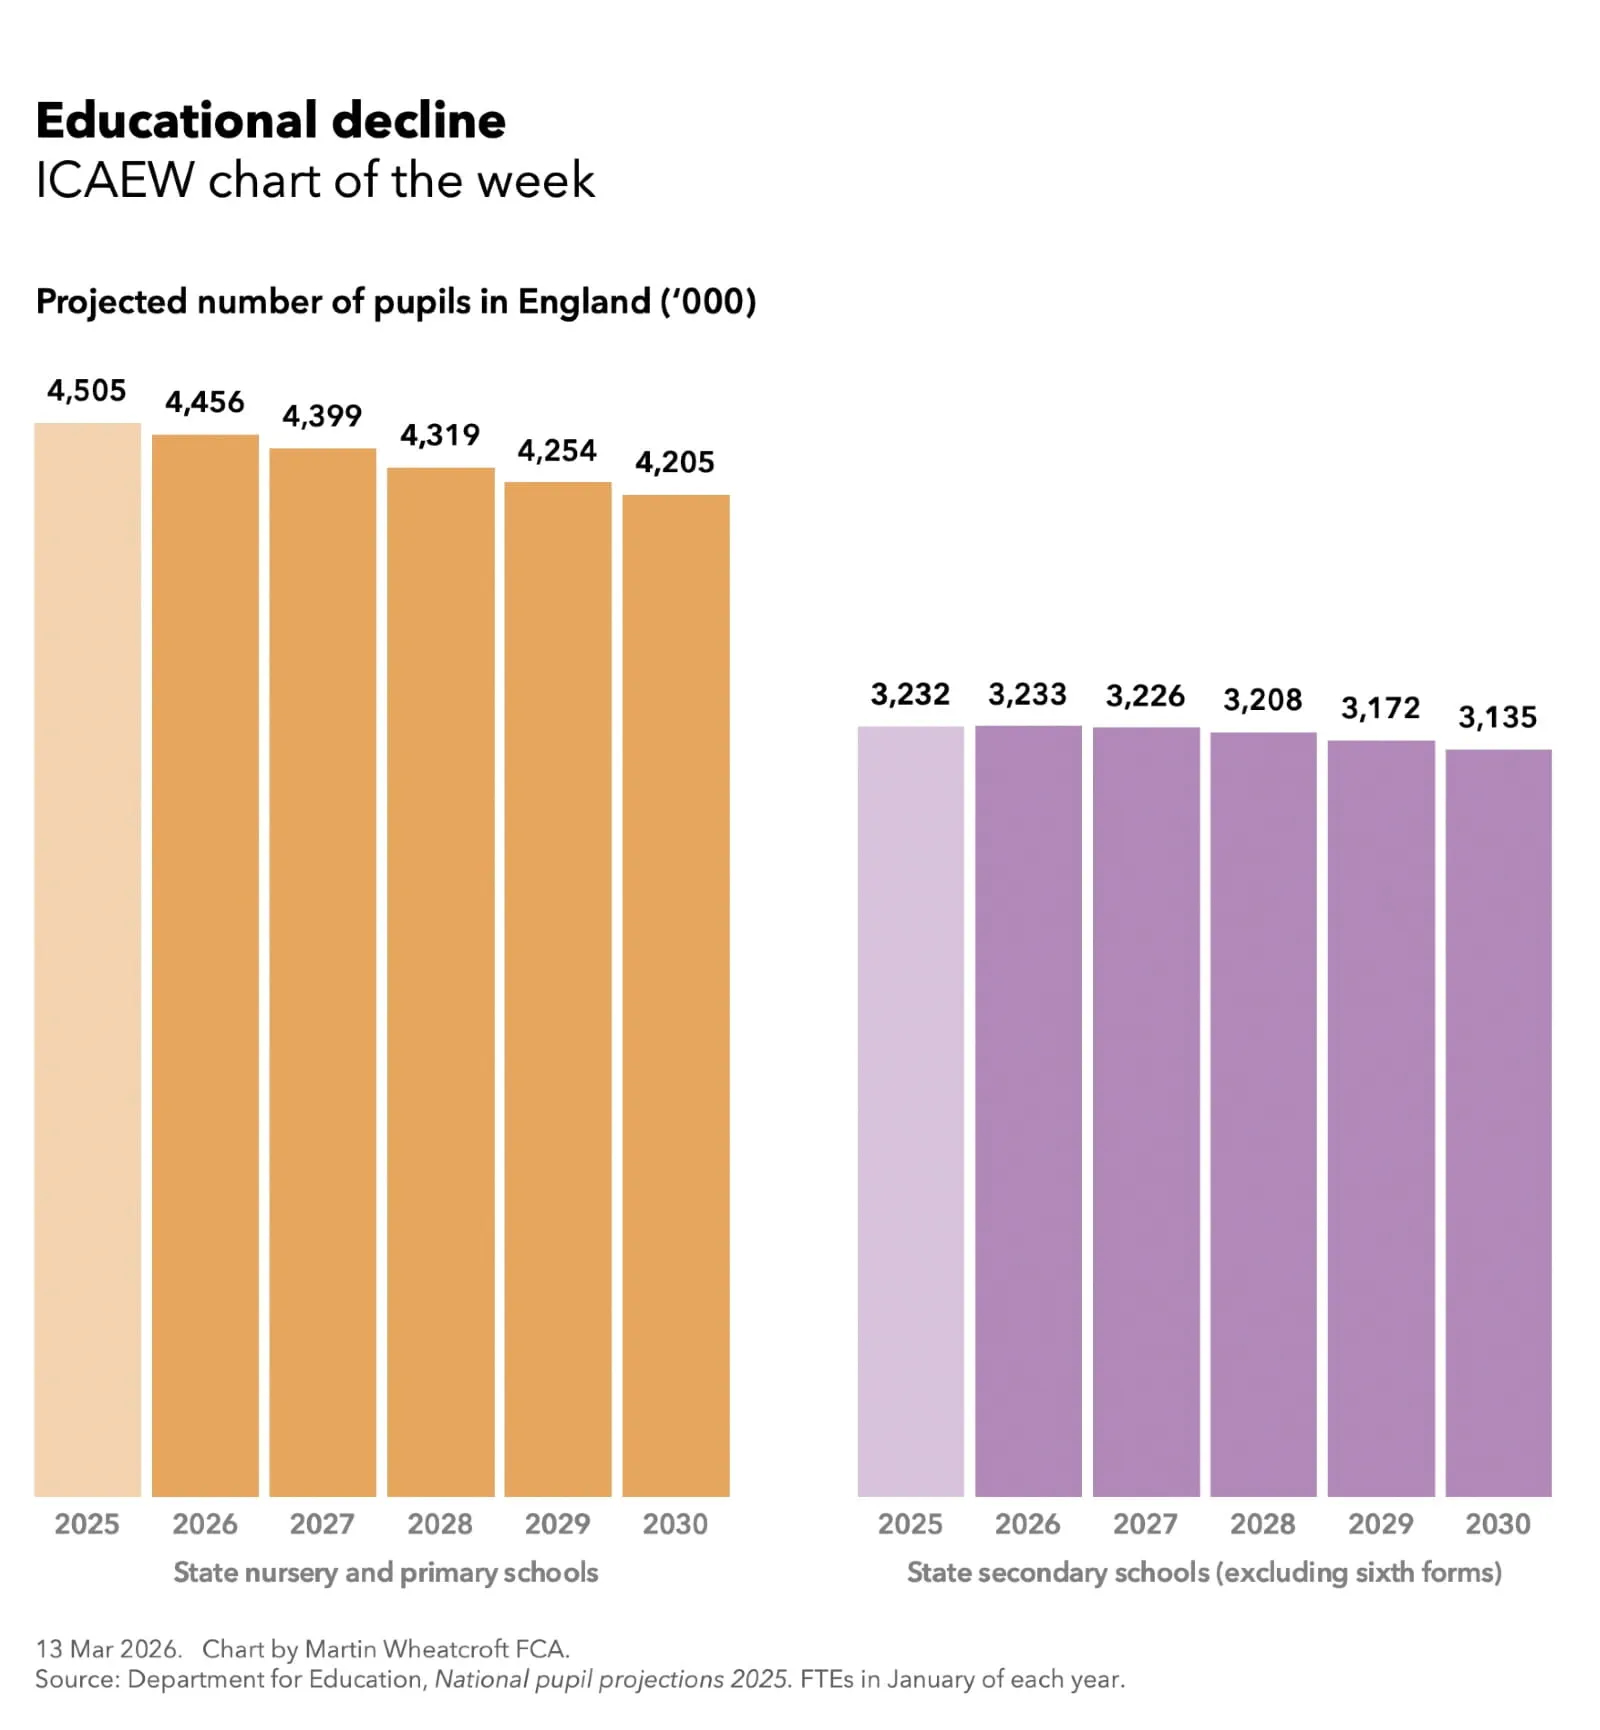
My chart for ICAEW this week looks at how school rolls in England are projected to decline by 7% in state nurseries and primaries and 3% in state secondaries over the next five years, and what that means for school closures and mergers across the country.

ICAEW chart of the week: Educational decline. 

Twin column charts showing the projected number of pupils in England (in thousands) between 2025 and 2030. 

State nursery and primary schools" 4,505 in 2025, 4,456, 4,399, 4,319, 4,252 and 4,205 in 2030. 

State secondary schools (excluding six forms): 3,232, 3,233, 3,226, 3,208, 3,172 and 3,135 in 2030. 

13 Mar 2025. Chart by Martin Wheatcroft FCA. 
Source: Department for Education, National pupil projections 2025. FTEs in January of each year.

According to Department for Education statistics, there were 8,384,000 school pupils under the age of 16 in England in January 2025 (ages recorded as of 31 August 2024). Of these, 4,505,000 were in maintained nursery and state primary schools, 3,232,000 were in state secondary schools, 146,000 were in state special schools, 482,000 were in independent schools and 16,000 were in alternative provision.

My chart for ICAEW this week shows how the largest two categories of schools are projected to change over the next five years, starting with a projected 7% fall in pupil numbers in state nursery and primary schools from 4,505,000 in the last academic year to 4,205,000 in 2030. This follows a decline of 3% since 2019 when state nursery and primary numbers peaked at 4,652,000.

Meanwhile the number of state secondary school pupils under the age of 16 at the start of the academic year is expected to decline from 3,322,000 in January 2025 to 3,135,000 in January 2030, a fall of 3% from the peak.

Driven by a falling birthrate, the 7% projected fall in state nursery and primary school pupils is likely to be a political hot potato for local authorities and government in the face of what is likely to be a large number of ‘save our local school’ campaigns. London has already seen a significant number of primary school closures over the past five years, but the further drop projected is likely to see most parts of the country affected to a greater or lesser extent.

The 3% decline from the peak in secondary school pupil numbers will also present challenges, especially as the fall in numbers is unlikely to be spread evenly across the country. Some will see smaller falls or even rises in their school rolls, while others will see a much greater drop in their intakes. Reducing the number of classes in each year is a likely response for some schools, but entire school closures and mergers are almost inevitable.

The core of the projections is the provision of school places for children who are already in the education system or have already been born, but uncertainties about the rapidly falling birth rate meant that the Department for Education limited their projections to five years instead of their traditional ten-year outlook. With these projections, the main uncertainty is in the level of migration, with government actions to restrict legal immigration likely to see the next projections revised down even further when they are released this summer.

In theory, falling school rolls should reduce pressures on the education budget while at the same time potentially increasing per pupil funding. In practice, pressures on the public finances are so large that the government is likely to be looking for every saving they can find.

This chart was originally published by ICAEW.