ICAEW chart of the week: BBC finances

22 January 2020: The BBC’s finances are in the spotlight for this week’s chart, as it struggles to generate the income it needs to fund its public service broadcasting mission.

National Audit Office report out this week on the BBC’s strategic financial management highlights the financial pressures facing the BBC as it seeks to deliver on its universal public service broadcasting obligation in the face of a rapidly changing media landscape.

The #icaewchartoftheweek illustrates how the BBC generated revenue of £4.9bn in the year ended 31 March 2020. This is less than the £9bn or so generated by Sky in the UK & Ireland each year, but more than ITV’s £3bn or Channel 4’s £1bn. 

The principal source of income is the TV licence fee, which generated £3.2bn in 2019-20 from 21.2m households. This excludes 4.5m households that received free licences, with the government providing £253m to cover this in addition to an £87m grant for the World Service. Other income generated by the public service broadcasting arm amounted to £0.2bn, while BBC Studios and other commercial activities had external revenues of £1.2bn.

Expenditure of £5.0bn included £4.0bn incurred on public service broadcasting, paying for eight TV channels and 60 radio stations in the UK, radio services around the world in more than 40 languages and extensive online services – most notably BBC iPlayer. 

The BBC’s domestic TV and radio channels cost £1,609m and £494m respectively, while £238m was spent on BBC Online and £315m on the BBC World Service, of which £228m was funded from the licence fee. £204m was incurred on other services (including a contribution to S4C), while distribution, support and other costs incurred amounted to £1,070m, excluding £119m of licence fee collection costs.

A colour TV licence in 2019-20 cost £154.50, equivalent to £12.88 per month and the BBC estimates that £6.83, £2.22, £1.24 and £1.24 of each licence fee went on TV, radio, BBC Online and the World Service respectively, while £1.35 paid for other services, distribution and support, licence fee collection and other costs.

Commercial activities contributed £176m to the bottom line, providing a small subsidy to licence fee payers, with attempts by the BBC to start a global subscription service for British TV content in partnership with ITV (Britbox) yet to bear much fruit. The principal commercial revenue stream remains sales by BBC Studios to broadcasters around the world, together with advertising from the seven UKTV channels now wholly owned by BBC Studios and declining amounts from DVD sales. 

At the bottom line, the BBC incurred a loss of £119m in 2019-20, following on from a loss of £69m in the previous year and a profit of £180m in 2017-18. An improved contribution from commercial activities was not enough to offset the cut in the government funding for free TV licences for over-75s, which fell from £656m in 2017-18 to £253m in 2019-20. This funding has now ceased and from 1 August 2020 the BBC reintroduced licence fees for around three million over-75s households, retaining free licences for 1.5m or so over-75s households receiving pension credit (a welfare benefit for pensioners on low incomes).

There is a lot of debate both inside and outside the BBC about the future of the licence fee model and whether it can survive in a landscape of global streaming services. As it approaches its 100th anniversary in October 2022, the BBC will be hoping it can find a way to extend its public service broadcasting mission for a second century.

This chart was originally published by ICAEW.

ICAEW chart of the week: China

18 September 2020: The #icaewchartoftheweek is on China: with 1.4bn people, the largest country in world by population.

Following up on our chart on the United States of America a couple of weeks ago, this time we are looking at China, which has more than four times as many people as the USA and more than 20 times as many as the UK.

There are a number of different ways of allocating China’s 33 first-level administrative divisions (excluding Taiwan) into wider regions, but for this particular chart we have gone with the five military districts used by the People’s Liberation Army, which divides up the provinces into Western, Southern, Central, Eastern and Northern China.

Three regions are similar in population size to the USA, with the 346m population of Central China and 337m of Southern China exceeding the USA’s 332m, while Eastern China with 315m people is not far behind. Northern China with 235m people has about 70% of the numbers in the USA, while Western China with 183m has just over half as many. They all substantially exceed the UK’s 69m population.

At 9.60m square kilometres China is marginally smaller than the USA’s 9.84m, although if inland waters are excluded this turns around with China’s 9.33m square kilometre land area exceeding the USA’s 9.15m. Hence, there is around four times as much space per person in the USA than in China, which in turn has twice as much space per person as for the UK.

Economically, China was around 30% bigger than the USA on a ‘purchasing power parity’ (PPP) basis in 2019, when US GDP was $21.4tn. However, based on actual exchange rates, China’s economy was around two-thirds of the size. Economic activity per person in China in 2019 was around $20,000 on a PPP basis and $10,000 on an actual exchange rate basis, compared with the $64,000 or so per person that was generated in the USA. This compares with the UK, where economic activity in 2019 was in the order of $45,000 per person using PPP and $41,000 using actual exchange rates.

China is not expected to remain the largest country by population for much longer, with India’s just under 1.4bn people expected to grow at a faster rate to overtake China within the next decade.

Image of table showing population by province within each region. For readable version of the table please go to the original ICAEW chart using the link at the end of this post.

This chart was originally published on the ICAEW website.

ICAEW chart of the week: Foreign, Commonwealth & Development Office

11 September 2020: The UK’s highly regarded diplomatic service in the FCO was combined last week with the UK’s highly respected international development department DfID to form a new government department – the FCDO.

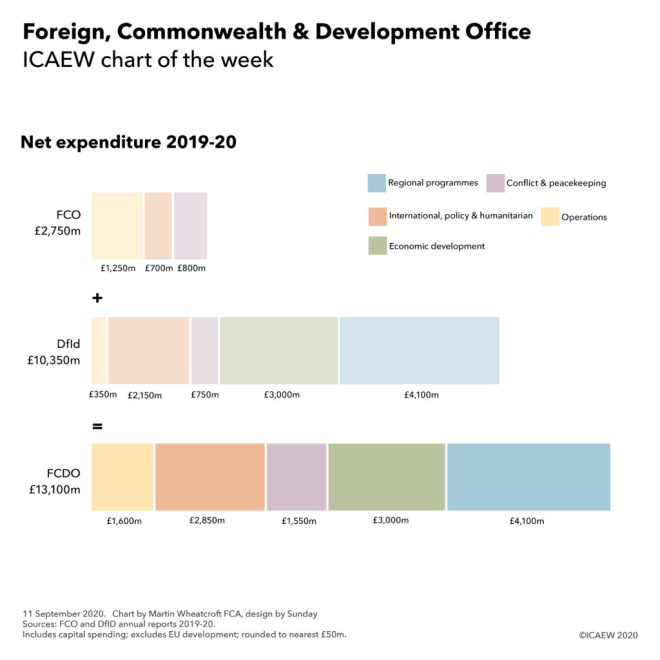
Chart on net expenditure 2019-20 FCDO £2,750m + DfID £10,350m = £13,100m.

The newly established Foreign, Commonwealth & Development Office (FCDO) is the subject of the #icaewchartoftheweek, illustrating the amounts spent by its predecessor departments in the financial year ended 31 March 2020. The Foreign & Commonwealth Office (FCO) incurred net expenditure in the order of £2,750m, while the Department for International Development (DfID) spent £10,350m, a combined total of £13.1bn.

Although DfID was the bigger department in financial terms, the FCO was larger operationally with 13,751 staff in 2019-20 (5,263 in the UK and 8,488 abroad) compared with the 3,535 employed by DfID (2,628 in the UK and 773 abroad). As a consequence, net operational spending amounted to somewhere in the region of £1,250m for the FCO, while DfID cost in the order of £350m to run.

The FCO spent approximately £700m in 2019-20 on international programmes, including grants to the British Council and the BBC World Service amongst others. The other big element of its spending of just under £800m was on conflict prevention, stability and peacekeeping.

DfID spent around £2,150m on international development programmes and organisations, policy, research and evidence and humanitarian aid and £750m on conflict, security and stabilisation. Around £3,000m was spent on economic development, while £4,100m went to regional programmes, including approximately £900m in west and southern Africa, £1,300m in east and central Africa, £850m in the Middle East and north Africa and £1,050m in Asia and elsewhere in the world.

DfID has provisionally calculated that total development spending across the UK Government, including by the FCO, DfID, Home Office, Business, Energy & Industrial Strategy and Department for Environment, Food and Rural Affairs departments, amounted £15.2bn in total in the 2019 calendar year. This was in line with the UK Government’s legally binding commitment to spend 0.7% of Gross National Income on development. This includes a proportion of the EU’s spending on international development but excludes the UK’s contributions towards development within the EU, in particular in eastern European member states.

The coronavirus pandemic has reduced the size of the economy this year and hence the 0.7% calculation will result in a smaller amount to spend in 2020-21, hence the combined budget for the FCDO will be smaller than the amount spent in the last financial year.

The new department is abbreviated to FCDO in writing, which the Government is insisting should be spoken out loud as ‘focado’ (similar to the online grocery store), no doubt in a valiant attempt to prevent other forms of short-form pronunciations becoming popular.

This chart was originally published on the ICAEW website.

ICAEW chart of the month: Cricket – England v West Indies 3rd Test

31 July 2020: Summer is the time for a special edition of the #icaewchartofthemonth, celebrating the victory of the English men’s cricket team over the West Indies in the 3rd Test at Old Trafford, resulting in a 2-1 series win for England.

Chart: England 1st innings 369 + 2nd innings 226 = 595. West Indies 1st innings 197 + 2nd innings 129 = 269 short of target.

Many explanations of cricket as a sport tend to focus on the intricacies of how it is played but in practice, the aim is pretty simple – one team sets a target by scoring as many runs as they can and the other team then tries to beat that target. Of course, like most sports, the joy is often as much in the skills of the players and the tactics deployed as much as who wins or loses, but the principal objective remains the same: score more runs than the other team.

West Indies no doubt regretted putting England into bat first, as England proceeded to score 369 runs in the first innings, significantly better than the 197 the West Indies team achieved in reply. England then extended their total by adding 226 runs before declaring, giving the West Indies a stretching target of 398 to tie or 399 to win. A strong England bowling performance meant West Indies only achieved 129 by the time they were bowled out mid-afternoon on the fifth day, falling short of the overall target of 595 runs by 269.

Stuart Broad had a stand-out match, scoring 62 runs in England’s first innings and taking 6 and 4 wickets respectively in the West Indies’ two innings – including the 500th wicket of his international test career. Chris Woakes, who took 5 of the West Indies’ wickets in their second innings, was the other key English bowler, while Rory Burns (scoring 147 runs across two innings), Ollie Pope (91) and Joe Root (85) were the highest scoring English batsmen. More details are in the scorecard.

Cricket can be a mystery to many, with unique features such as whole days abandoned to rain – as the fourth day of this test match was. Some have even likened cricket to a ritualised rain-dance, helping to make England the green and pleasant land that it is. For others, cricket is a different sort of mystery, providing sporting magic that makes an English summer complete.

The #icaewchartofthemonth and #icaewchartoftheweek will be off for August before returning on Friday 4 September. We hope that you will be able to take some time off to enjoy the summer, wherever and however that may be possible.

This chart was originally published by ICAEW.

ICAEW chart of the week: UK population in lockdown

3 July 2020: Only a fraction of the population was working at their normal workplace during the Great Lockdown, but what will happen as businesses start to re-open and the furlough scheme becomes less generous?

UK population 67m: workforce 34m (working at workplace 9m, working from home 10m, furloughed 12m, unemployed 3m); outside workforce: children & students 16m, retired 12m, other inactive 5m.

The #icaewchartoftheweek takes a look at the workforce this week, illustrating how the lockdown has transformed the world of work over the last three months.
 
Our (admittedly) back of the envelope calculations based on ONS and HM Treasury data suggest that only around 9m of the 34m strong workforce have been working normally at their ordinary places of work during the lockdown, with somewhere in the region of 10m working remotely. In addition, just under 12m workers have been furloughed, comprising 9.3m employees on the coronavirus job retention scheme (CJRS) and 2.6m self-employed on the self-employed income support scheme (SEISS).
 
Unemployment, which was around 1.2m back in February, has jumped to an extrapolated estimate of around 2.7m by the end of June and is likely to grow still further as the furlough scheme becomes less generous from 1 July. The ONS’s experimental claimant count metric, which includes a wider group of workers needing financial support from the state, had reached 2.8m by the end of May and is expected to have exceeded 3m by the end of June.
 
The overall workforce of 34m excludes the 33m ‘economically inactive’ half of the population, comprising 16m children and students, 12m retirees and 5m other inactive individuals. The 2.1m students over the age of 16 included in this category excludes around 1m or so students with part-time work or who were looking for work prior to the lockdown who are included in the workforce numbers, while retirees include around 1.2m below the age of 65 who have taken early retirement. Other inactive individuals between the ages of 16 and 64 include 1.8m homemakers, 2.3m disabled or ill, and 1.1m not working for other reasons.
 
These numbers are a moving target as more workers will start to return to their normal workplaces over the next few weeks as the economy starts to re-open, even if many continue to work from home where they can. More worryingly, unemployment is likely to rise significantly with the furlough scheme requiring an employer contribution from July onwards and when it comes to an end in October.

This #icaewchartoftheweek was originally published by ICAEW.

ICAEW chart of the month: Cabinet government

26 June 2020: The prime minister has announced a reduction in the number of government departments. How big is the cabinet compared to the rest of the world?

The news that the UK Government is reducing the number of government departments by one prompts the #icaewchartofthemonth to take a look at the size of government executives across the world.
 
As the chart highlights, with 26 members, the UK cabinet is one of the largest amongst major economies – comprising the prime minister Boris Johnson, 21 department ministers and four ‘ministers attending cabinet’. This does not include the Cabinet Secretary or other officials, meaning that cabinet meetings generally involve more than 30 people in total.
 
Compare that with the more compact 16-member German federal cabinet (Chancellor Angela Merkel and 15 departmental ministers) and the ten-member Chinese state council executive (comprising the premier Li Keqiang, five vice-premiers and four other senior departmental ministers).
 
It is certainly much larger than FTSE-100 company boards, where the average size is 11, and very few listed companies have more than 16 board members.
 
There is some debate around whether reducing the size of the UK cabinet would be more conducive to effective government. Some suggestions that the merger of the Department for International Development (DfID) with the Foreign & Commonwealth Office (FCO) to form the new Foreign, Commonwealth & Development Office (FCDO) in September is the first step on the way to that goal – with further mergers possible. However, although there will be one fewer departmental minister, there is a reasonable prospect of the minister responsible for development at the FCDO being invited to attend cabinet given its importance to the government’s global agenda.
 
Of course, merging departments is not the only way to achieve a slimmer cabinet – for example, the 31-member Russian cabinet (not shown in the chart) rarely meets as one body. Instead, there are regular meetings of the 10-strong prime ministerial group (the prime minister Mikhail Mishustin and nine deputy prime ministers) and occasional meetings of the 20-strong cabinet praesidium that includes the most senior ministers as well.
 
The UK Cabinet also works in this way to a certain extent, with critical decisions often being made in smaller groupings of senior ministers, such as the 9-member National Security Council, the 9-member Climate Change Committee or the 12-strong EU Exit Operations Committee for example. Canada, with its 37-member cabinet, also operates through a series of cabinet committees ranging from around 8 to 15 members. However, in both cases, the full cabinet still meets regularly and remains the formal executive body for authorising government actions.
 
With rumours of a cabinet reshuffle in the UK this autumn, it will be interesting to see whether moves to reduce the size of the cabinet will actually take place or whether we will see further development of cabinet committees as the places to be ‘in the room where it happens’.

This chart of the month was originally published by ICAEW.

ICAEW chart of the week: Money for nothing

22 May 2020: The UK Government is being paid to borrow money, with first negative yield gilt

Cash invested £1,026.35 (nominal value £1,000, premium and interest £26.35). Cash returned £1,026.25 (7 coupon payments £26.25, principal repayment £1,000). Net return -£0.10, yield -0.003%.

The news this week that the UK Government issued debt with a negative interest rate is the subject of the #icaewchartoftheweek. This shows how purchasers of the 0¾% Treasury Gilt 2023 at an auction on Wednesday 20 May accepted a negative yield of -0.003% on their investment.

At an average price of £102.388 for each £100 gilt or £1,023.88 for ten gilts, someone buying gilts at the auction would have paid £1,026.35 to the Government for each £1,000 of nominal value purchased, once £2.47 for interest already accrued payable with the bid is included. 

That investor will receive less money back, with 7 semi-annual coupon payments of £3.75 before repayment of the principal of £1,000 on 22 July 2023 adding up to £1,026.25, a net loss of 10p.

This is a return of just under -0.01% over 38 months on the £1,026.35 invested, equivalent to an annualised yield of -0.003%.

This is only just negative, and the UK Government still needs to pay to borrow for longer periods, with yields on 10-year and 30-year gilts still in positive territory at around +0.24% and +0.63% respectively.

Although this gilt auction is a milestone, being the first fixed-rate government bond with a duration over two years to be issued at a negative yield in the UK, this is not a new phenomenon in the world of government borrowing. For example, with 10-year and 30-year government bonds currently yielding -0.49% and -0.07% respectively, Germany’s €156bn of projected borrowing this year should end up reducing its interest bill!

Whether this presages a similar situation in the UK is unknowable, so we are not yet at the stage of money for nothing.

This chart of the week was originally published by ICAEW.

ICAEW chart of the month: UK international trade

Imports £718bn: EU £369bn, EFTA £34bn, USA £87bn, Other Americas £26bn, Asia-Pacific £138bn, Other £64bn. Exports £673bn: EU £297bn, EFTA £29bn, USA £133bn, Other Americas £29bn, Asia-Pacific £108bn, Other £77bn.

With recent changes in ICAEW communications, the ICAEW Public Sector team has started an #icaewchartofthemonth to complement the #icaewchartoftheweek.

The first #icaewchartofthemonth was published on the ICAEW’s Insights Hub (icaew.com/insights) on Friday 31 January 2020 and is on the UK’s international trade. It highlights how important the £718bn in imports and £673bn in exports in the year to 30 September 2019 are to the economy of the UK.

As the UK Government starts to negotiate new trade arrangements with countries around the world, the EU will be the highest priority. Imports into the UK of £369bn represent 51% of total imports and exports to the 27 EU countries of £297bn are 44% of total exports. This is followed by the USA, where imports of £87bn and exports of £133bn represent 12% and 20% respectively.

Trade relationships with countries in the Asia-Pacific region will also be very important, in particular China (imports £60bn and exports £39bn), Japan (£17bn and £15bn) and the 10-country Association of South East Asian Nations (£22bn and £19bn).

https://www.icaew.com/insights/features/2020/jan-2020/uk-international-trade

ICAEW chart of the week: Post-GE2019 fiscal deficits

With the General Election now complete, the Office for Budget Responsibility (OBR) was able to release a restated version of its March 2019 fiscal forecasts this morning, reflecting technical revisions to the way the fiscal numbers are calculated, in particular that of student loans. This enables us to update the numbers set out our GE2019 Fiscal Insight on the party manifestos as best we can, given that the OBR has not deigned to include either the changes to public spending announced in the Spending Round 2019 nor the tax and spending changes in the Conservatives manifesto.

As illustrated by the #icaewchartoftheweek, the revised baseline forecast for the fiscal deficit is now £50bn for the current fiscal year, followed by £59bn next year in 2020-21, £58bn in 2021-22 and 2022-23 and £60bn in 2023-24.

It was frustrating that the OBR scheduled their publication of these revised numbers for the first day of the General Election purdah period making it vulnerable – as happened – to being pulled. A day earlier and that would not have happened! Ideally, these revisions would have been published as soon as practical after the publication by the ONS of their revisions to historical numbers in September.

It would have been even better if the OBR had been able to update their economic forecast too, given that the current baseline is still based on an economic and fiscal analysis from nine-months ago. With weak economic growth over the first half of the financial year, it is likely that the OBR will cut its forecasts for tax revenues over the forecast period when it does get round to updating them, resulting in higher deficits – even before taking account of suggestions that the Conservative GE2019 winners plan to announce a splurge of more capital expenditures in the Spring Budget in February.

Unfortunately, we won’t see an updated long-term forecast until at least July 2020, when the OBR is scheduled to publish its next fiscal sustainability report on the prospects for the public finances.

ICAEW chart of the week: General Election 2019

With voters in the UK going to the polls tomorrow, the #icaewchartoftheweek is on the political party’s plans for the public finances.

All the political parties are promising to increase taxes, public spending and investment, with the plan to eliminate the fiscal deficit now well and truly abandoned. 

The Conservatives are promising the least in terms of additional spending and investment, with £3bn a year extra spending in 2023-24, £8bn in extra capital investment and tax rises broadly offsetting tax cuts. However, this is unlikely to be the final result as they have deferred significant financial decisions, such as the funding of adult social care, until after the election. 

Labour is planning to spending much more with £83bn a year more spending by 2023-24, funded by £78bn tax increases and £5bn from higher economic growth. They plan capital investment of £55bn a year and £58bn in total over five years to compensate ‘WASPI’ women. This is pretty ambitious, leading the IFS and others to cast doubt on the achievability of their plans, while these numbers don’t include the additional borrowing from their plans to nationalise utilities, nor the borrowing of those businesses post-nationalisation.

The Lib Dem plans are also very ambitious, with £50bn extra a year public spending by 2024-25 funded by £37bn in higher taxes and £14bn in higher economic growth from cancelling Brexit. They plan to borrow an extra £25bn a year to fund new capital investment.

The Greens’ are planning to be even more ambitious, including completely reforming welfare provision with the introduction of a universal basic income, contributing to a £124bn increase in taxes and public spending (albeit some of this is a switch from tax deductions to cash payments). Their capital investment plans are the largest and likely to most difficult to deliver of all the major parties at £82bn a year on average over 10 years.

Unfortunately, none of the major political parties appear to have a fiscal strategy that extends beyond the next five years, with only limited measures to address the big financial challenges of more people living longer. This is disappointing given that relatively small actions taken now could make a big difference to the financial position of the nation in 25 years’ time.

ICAEW’s full analysis of the party manifestos can be found at icaew.com/ge2019manifestoanalysis.


You can be part of the conversation as part of ICAEW’s GE 2019: It’s More Than a Vote campaign.